

At BodyStats, our mission is to make advanced health tracking available to everyone — and part of that is sharing what we find in our own data, openly. We’ve looked at what happens to fat and muscle during weight loss and during weight gain, and at how often BMI mislabels people. This report is about the one number on a DEXA scan that no scale, no smart mirror, and no bioimpedance device can measure: your bone density.
Bone density is easy to ignore, because losing it doesn’t hurt. There are no symptoms. The first sign is often a fracture — a wrist, a hip — from a fall that shouldn’t have broken anything. By then, a lot of bone is already gone. A DEXA scan can see it years earlier. So we looked at what ours has been seeing.
What we did
We took every BodyStats client with a usable bone reading on their most recent scan — 8,068 people — and grouped them by age and sex. For each one we used the T-score: how their bone mineral density compares to a healthy young adult at peak bone mass. A T-score of 0 is average; every −1.0 is one standard deviation below that peak.
Throughout this report, “low bone density” means a T-score of −1.0 or below — the threshold where bone mass has dropped meaningfully under the young-adult norm. Here’s how that played out, decade by decade.
Men: steady for life
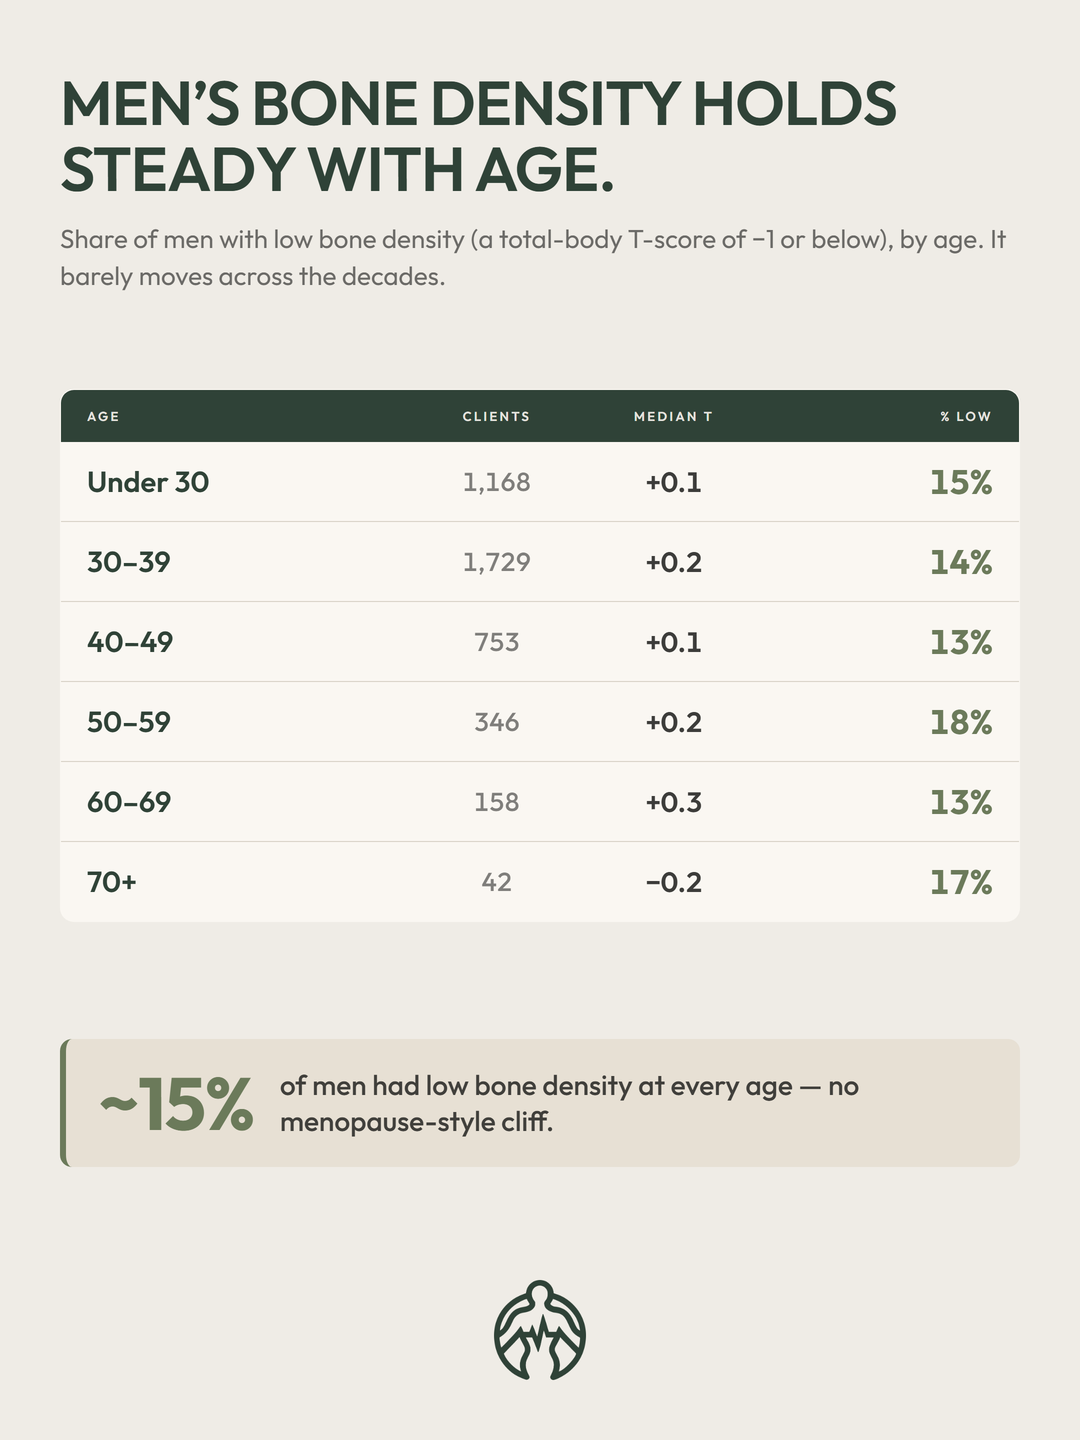
For men, the share with low bone density hovers around 13–18% at every age. There’s no obvious decline with age — a man in his 70s looks much like a man in his 30s. Men lose bone too, but slowly and steadily, without a single sharp drop-off point.
Women: the cliff after 50
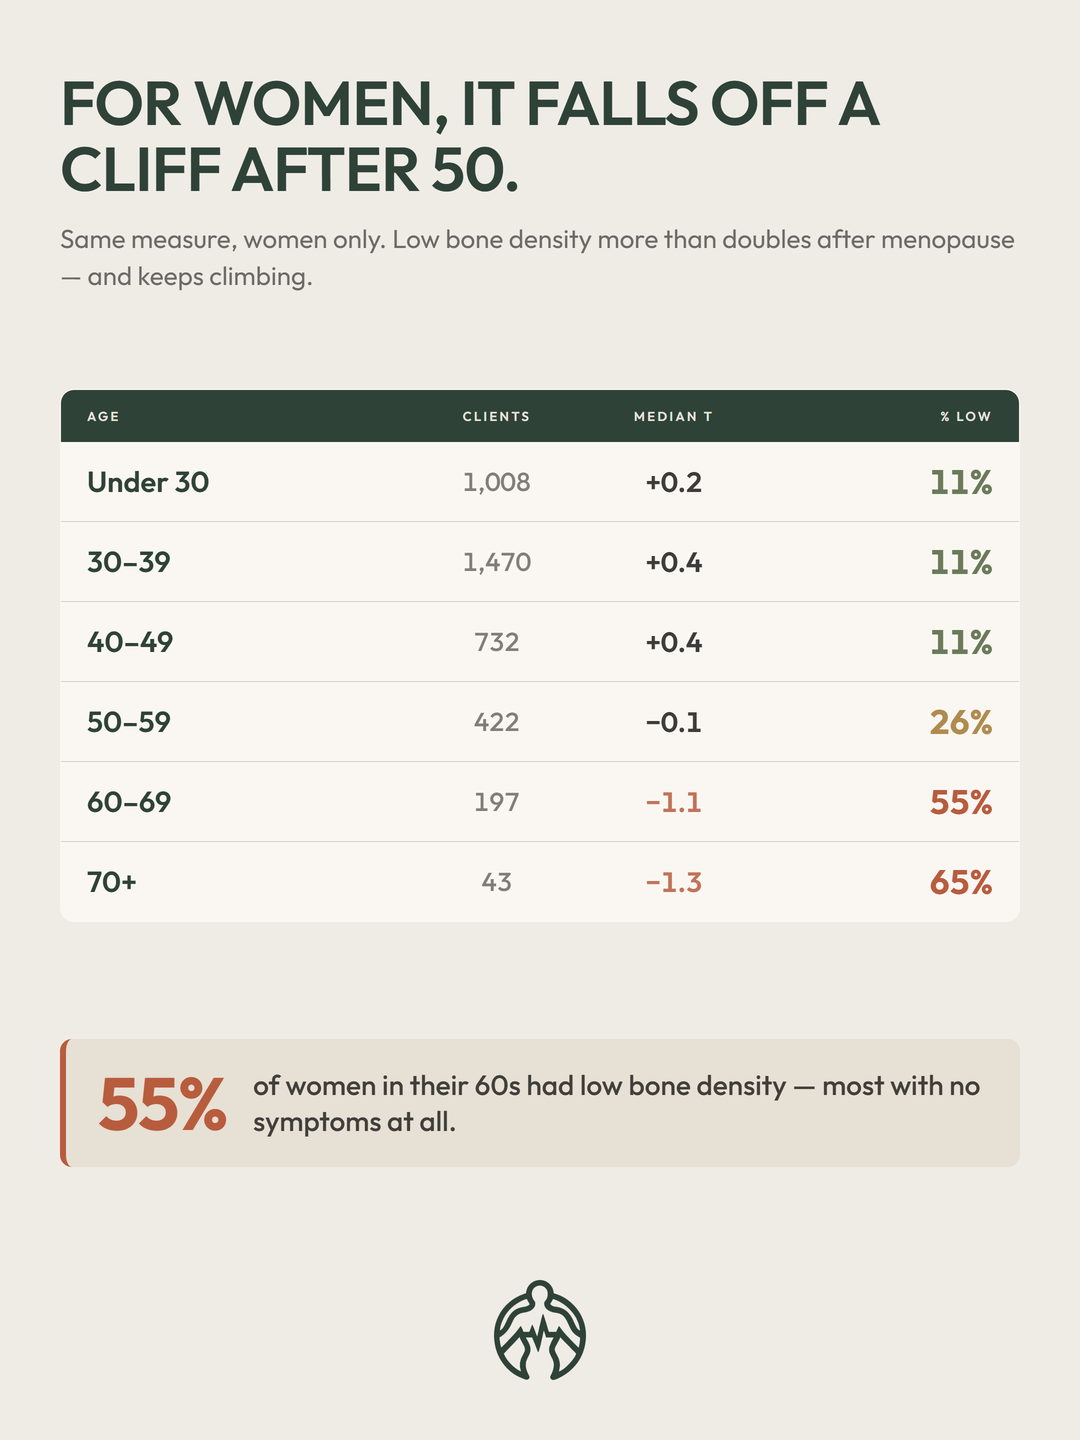
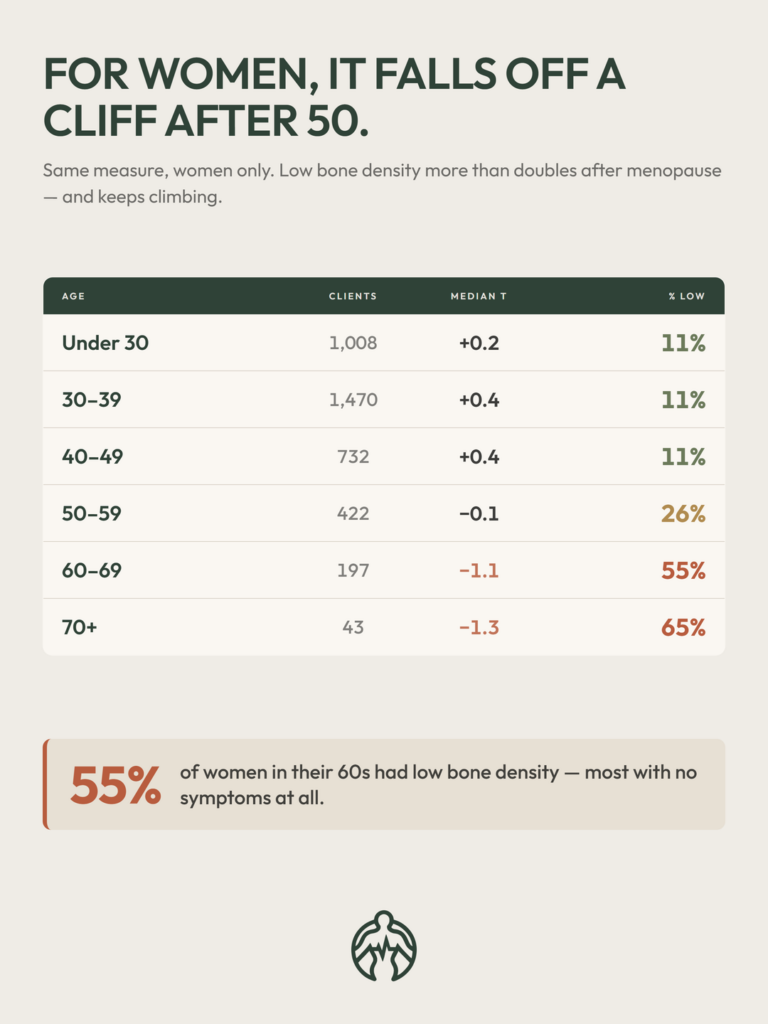
For women, the picture is completely different. Through their 40s, only about 1 in 9 had low bone density — better than the men. Then menopause arrives, estrogen drops, and bone loss accelerates fast:
- 50–59: 26% — more than double the rate a decade earlier
- 60–69: 55% — the majority
- 70+: 65% — roughly two in three
The median woman in her 60s had a T-score of −1.1 — already in the low range. That’s not a handful of outliers dragging an average down; it’s the typical result.
Why this is the number a scale can’t give you
You can weigh yourself every morning and never know any of this is happening. Body weight, BMI, even body-fat percentage tell you nothing about what’s going on inside your skeleton. Bone density is invisible to every tool most people own — and silent until something breaks.
That’s the case for measuring it before there’s a problem. The women in their 50s in our data — the 26% — are the ones with the most to gain from knowing early, while there’s still time to act on it with a doctor through training, nutrition, and medical options.
A few important notes on what you’re looking at
- This is awareness, not a diagnosis. A formal diagnosis of osteopenia or osteoporosis is made from a site-specific bone-density scan of the hip and spine, read by a physician. The figures here are total-body T-scores, which flag low bone mass but are not a clinical diagnosis. If anything here concerns you, talk to your doctor about a dedicated bone-density scan.
- This is a snapshot. We used each client’s most recent scan — a picture of who they are now, not how their bones changed over time.
- Our clients aren’t a random sample. People who come in for a DEXA tend to be more health-engaged than average, so these rates won’t map exactly onto the general population. The age-and-sex pattern, though — flat for men, a cliff for women after menopause — is exactly what the bone-health literature would predict.
- Bone loss is partly preventable. Resistance training, adequate protein, calcium and vitamin D, and — where appropriate — medical treatment all influence the trajectory. Knowing your number is the first step.
What we’ll look at next
We’re publishing what we find as we find it. Still on the list: visceral fat trajectories, body composition by age band, what a recomposition actually looks like on a scan, and how bone density tracks alongside muscle mass over time.
If there’s a question you want us to pull from the data, tell us. Leave a comment on the Instagram post that goes with this article (@body.stats), or reach out directly. We’ll pull what we can pull.
Our mission is to make advanced health tracking available to everyone. That includes the knowledge we gain along the way.