
What You’ll Get: Your Complete DEXA Scan Report
Most clinics hand you a single printout and send you on your way. At BodyStats, every scan comes with a detailed, easy-to-understand report that breaks down your body fat percentage, lean muscle mass, bone density, visceral fat, and more — with personalized comparisons and actionable recommendations.
Below is a complete page-by-page walkthrough of a real sample report so you know exactly what to expect.
What Does a DEXA Scan Actually Measure?
DEXA (Dual-Energy X-ray Absorptiometry) is the clinical gold standard for body composition analysis. Unlike a bathroom scale or calipers, a DEXA scan uses two low-dose X-ray beams to differentiate between three distinct tissue types in your body:
Fat Mass
Total body fat, including subcutaneous (under the skin) and visceral fat (around organs). Broken down by body region.
Lean Mass
Muscle, organs, water, and all non-fat, non-bone tissue. The number athletes track to measure training progress.
Bone Mineral Density
The concentration of minerals in your bones. Critical for assessing fracture risk and long-term skeletal health.
Visceral Fat (VAT)
Deep abdominal fat around vital organs. Strongly linked to cardiovascular disease and metabolic syndrome.
Part 1: Your BodyStats Report
This is the personalized report we create for every client. It translates your raw scan data into clear visuals, comparisons against population averages, and tailored recommendations you can act on immediately.
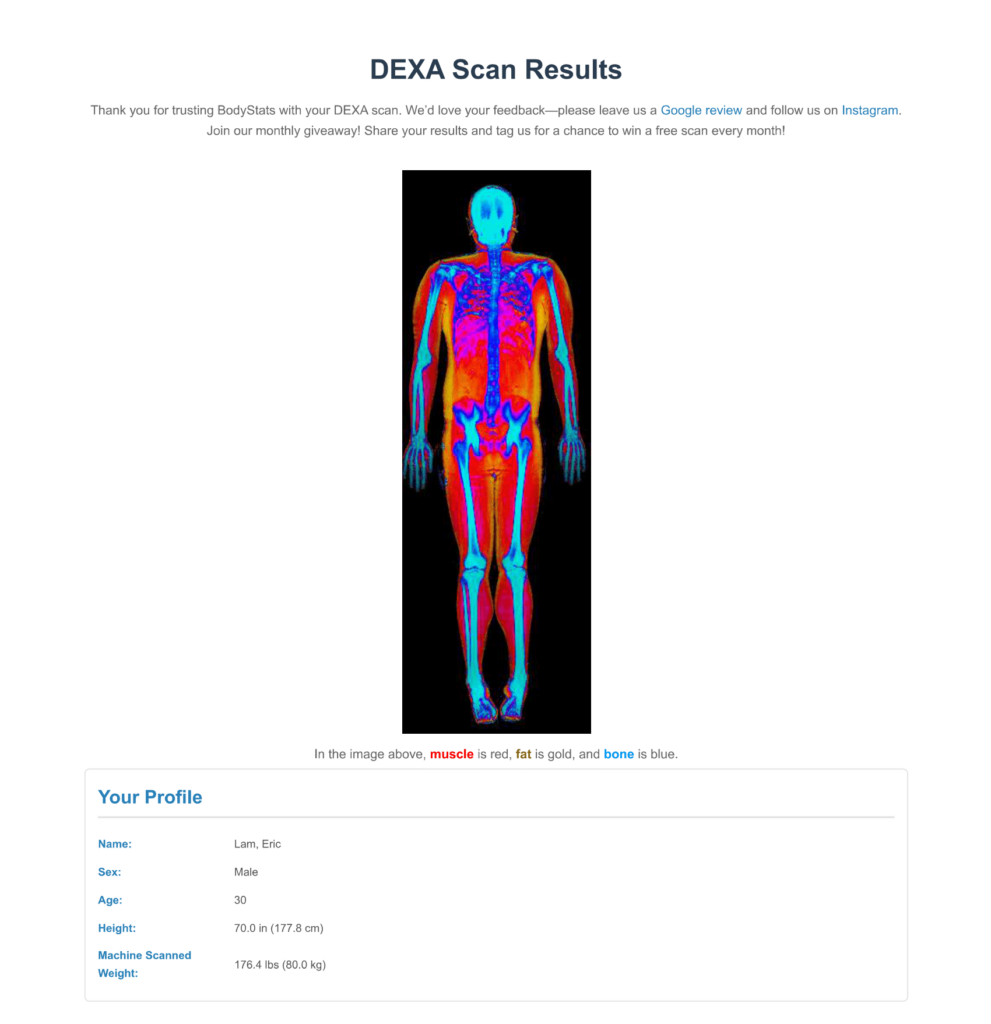
Page 1 — Your Body Composition Map & Profile
The first page features a full-body composition image generated directly from your DEXA scan. This color-coded map gives you an instant visual snapshot of your body’s makeup:
Muscle tissue appears in red, fat tissue in gold, and bone in blue. You can literally see where muscle and fat are distributed throughout your body.
Below the image, your personal profile confirms your demographics and the weight recorded by the machine at the time of your scan.
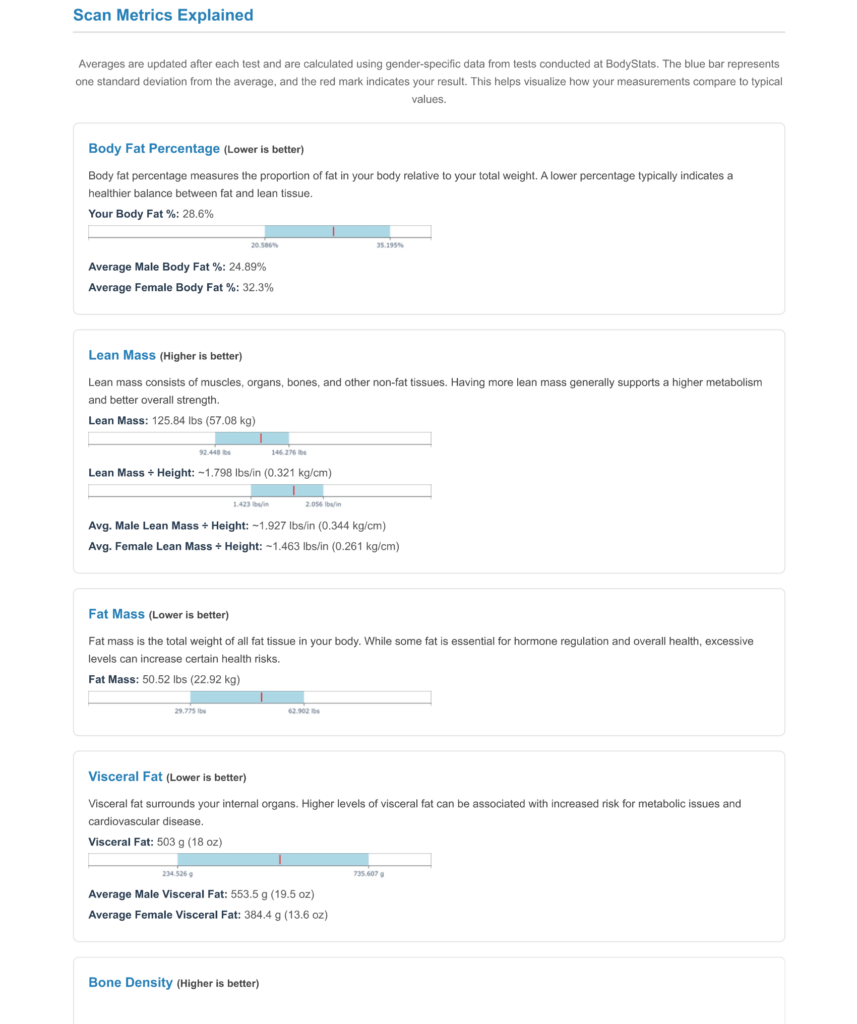
Page 2 — Your Key Metrics, Explained
This is the core of your report. Each measurement comes with a clear explanation, your exact number, and a visual bar chart comparing you to gender-specific averages from real BodyStats client data.
Body Fat Percentage — the proportion of fat relative to total weight, compared against male and female benchmarks.
Lean Mass — total muscle and non-fat tissue, plus your lean mass relative to height for a fairer comparison across body sizes.
Fat Mass — total fat tissue weight with context on healthy ranges.
Visceral Fat — deep abdominal fat in grams, often the single most actionable number on the report.
Bone Density — BMD in g/cm² compared against population averages.
Want to see your own numbers?
Book a DEXA scan and get your full personalized report with comparisons and recommendations.
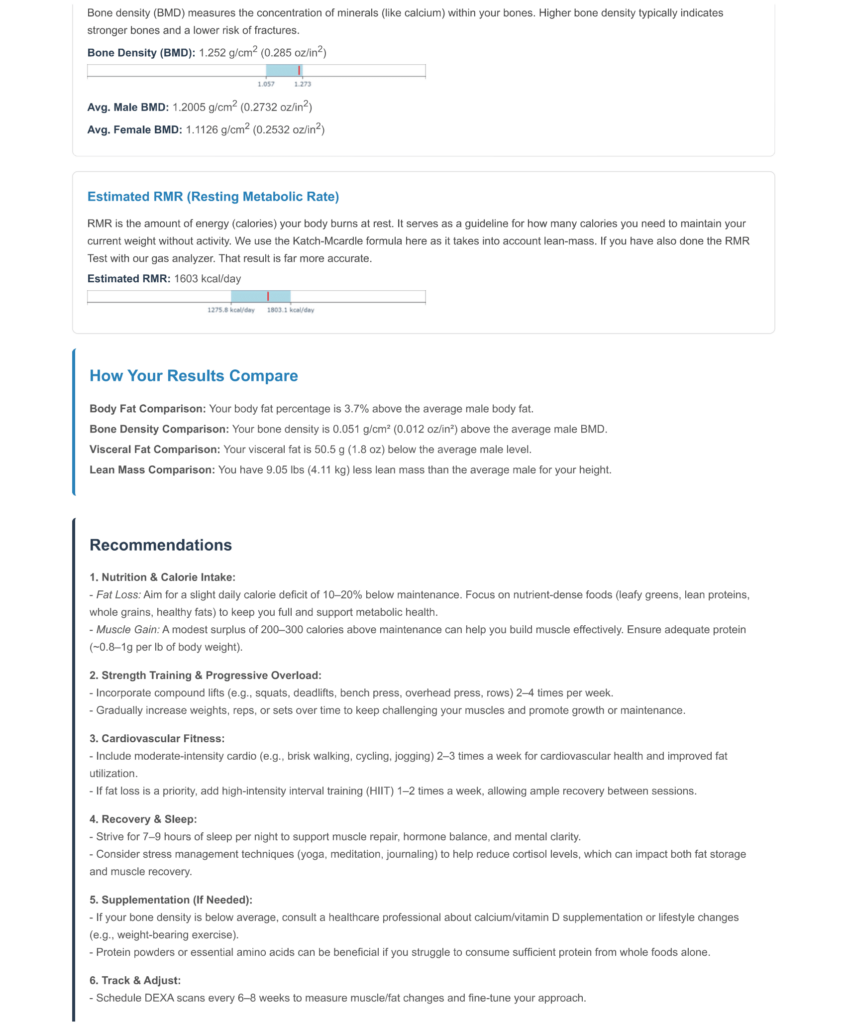
Page 3 — Resting Metabolic Rate, Comparisons & Recommendations
This is where your data turns into action.
Estimated RMR — how many calories your body burns at rest, calculated using the Katch-McArdle formula (which factors in lean mass). The foundation for any nutrition plan.
How Your Results Compare — a quick-reference summary of where you stand: body fat vs. average, bone density ranking, visceral fat levels, and lean mass for your height.
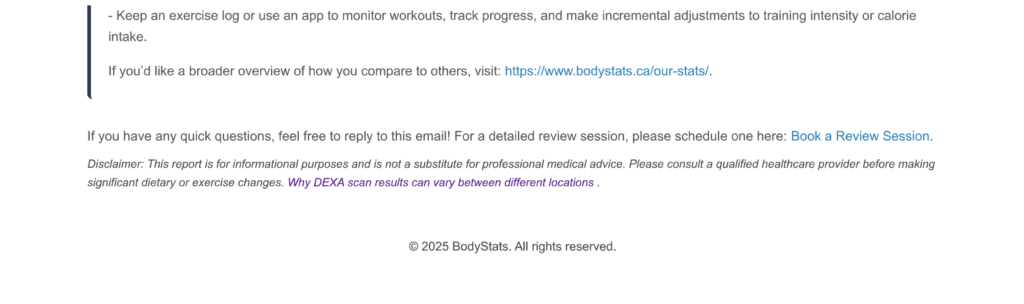
Personalized Recommendations — tailored guidance across six areas: nutrition, strength training, cardiovascular fitness, recovery, supplementation, and a tracking plan for your next scan. These aren’t generic tips — they’re informed by your actual data.
Part 2: Your Clinical Scan Data (Hologic Output)
In addition to our BodyStats report, you also receive the raw clinical output directly from the Hologic DEXA machine — the same data format used by hospitals and research institutions. This gives you a complete medical-grade record you can share with your doctor, physiotherapist, or sports medicine specialist.
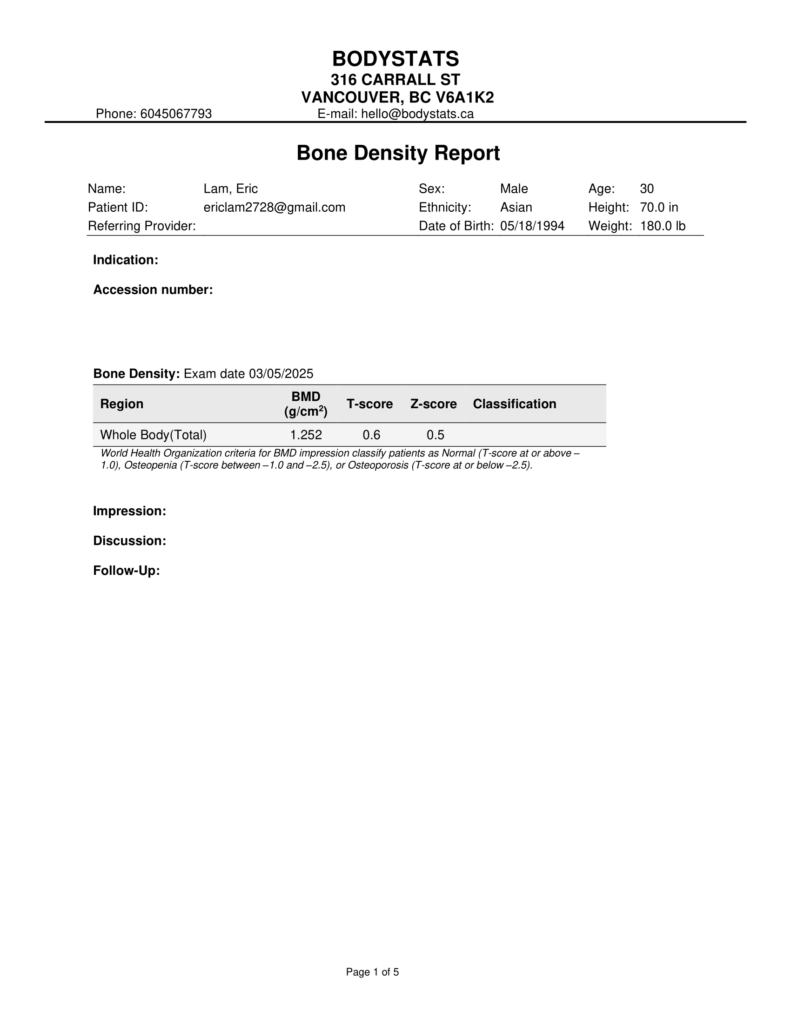
Clinical Page 1 — Bone Density Report
Your bone mineral density (BMD) results in clinical format, with two key scores:
T-score — compares your bone density to peak bone mass of a healthy 30-year-old. The WHO classifies -1.0 or above as Normal, -1.0 to -2.5 as Osteopenia, and below -2.5 as Osteoporosis.
Z-score — compares your density to the average for your age, sex, and ethnicity. This helps determine whether your results are typical for your demographic or warrant further investigation.
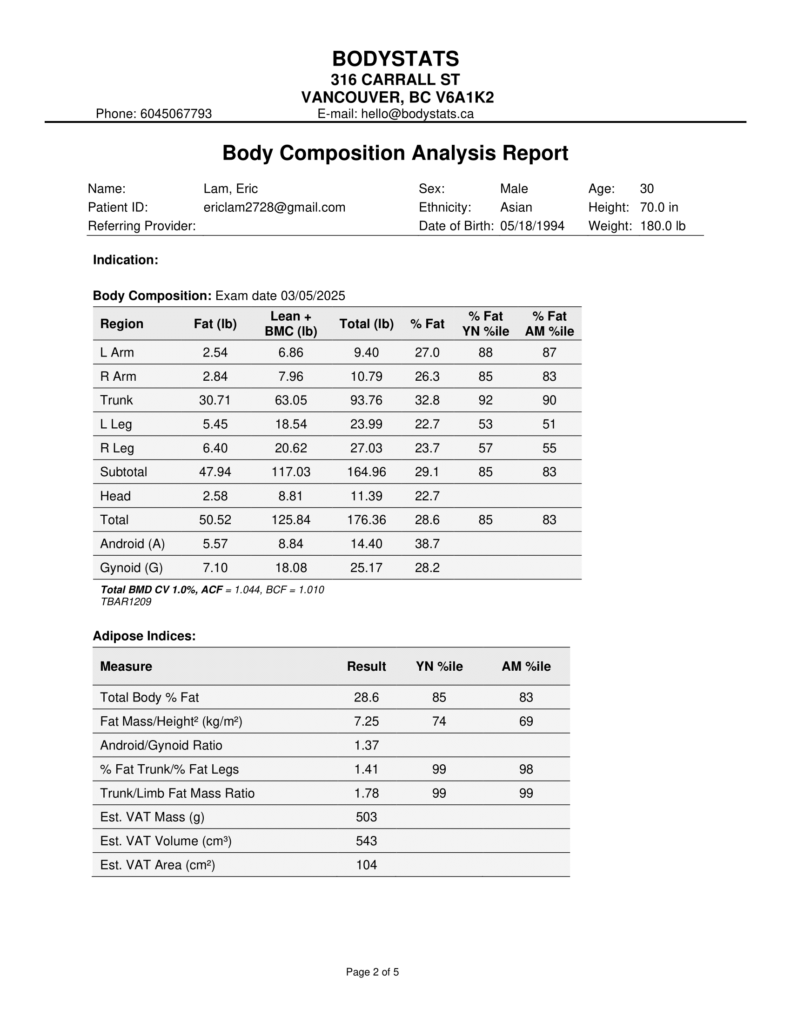
Clinical Page 2 — Regional Body Composition Breakdown
One of the most data-rich pages. It breaks down composition by region — left arm, right arm, trunk, left leg, right leg — showing exact fat, lean, and bone mineral content for each.
The Adipose Indices include your android/gynoid ratio (midsection vs. hip fat distribution), trunk-to-limb fat ratio, and detailed visceral fat measurements including mass, volume, and cross-sectional area.
Percentile columns show where you rank against both a Young Normal reference population and an Age-Matched group — so you know exactly how you compare.
This level of detail is what sets DEXA apart.
No other body composition method gives you regional breakdowns, visceral fat measurements, and bone density in a single 7-minute scan.
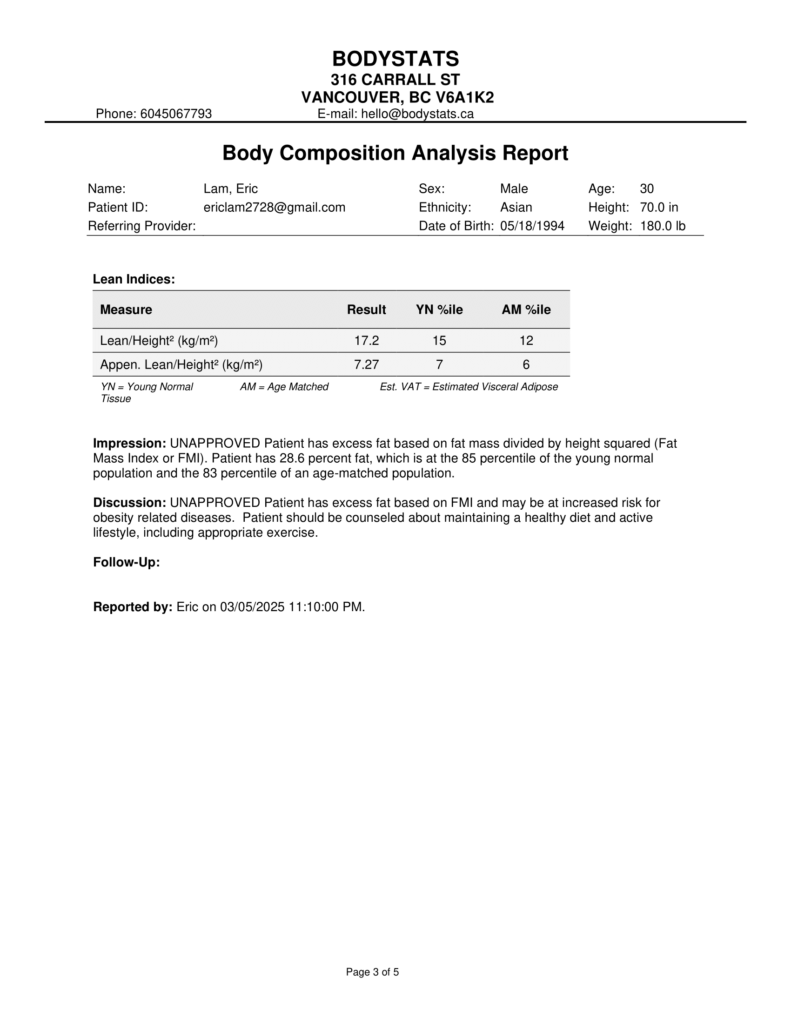
Clinical Page 3 — Lean Indices & Clinical Impression
Lean Indices — your lean mass and appendicular lean mass (arms + legs only) relative to height. Appendicular lean mass is a key metric used in clinical research to assess sarcopenia (age-related muscle loss) and overall functional fitness.
The Impression and Discussion sections provide a clinical summary based on your Fat Mass Index (FMI), including percentile rankings and notes on what your results may indicate for your health outlook.
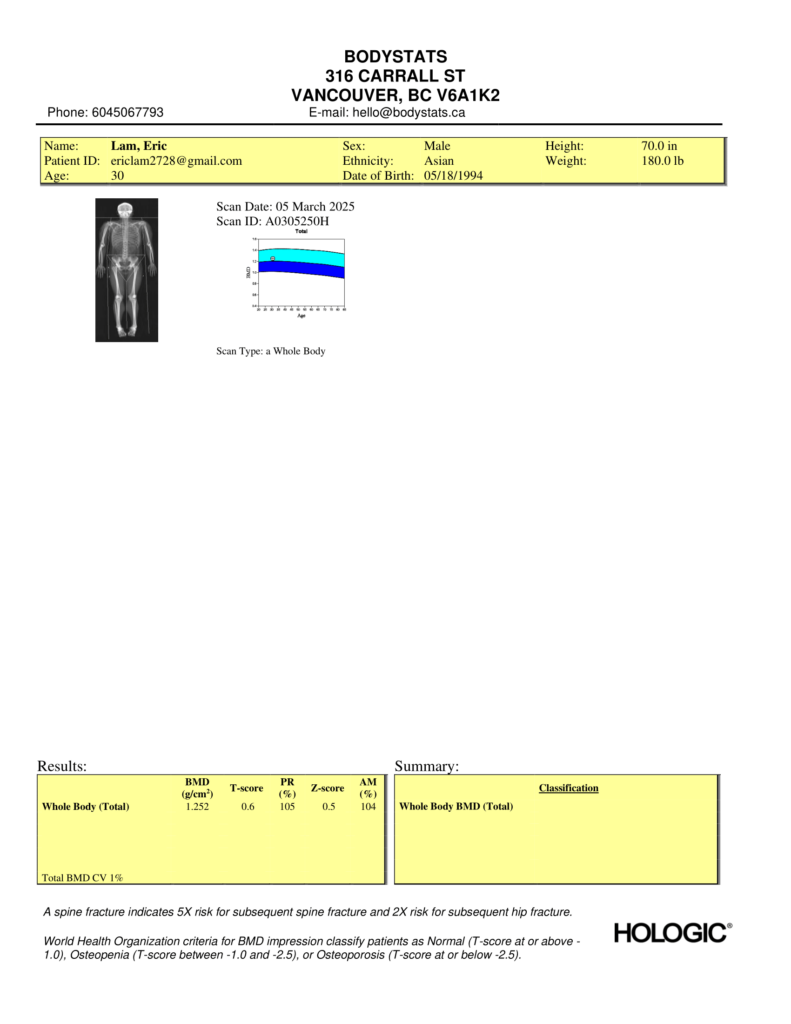
Clinical Page 4 — Bone Density Scan Image
The actual scan image used for your bone density assessment, alongside a summary results table. Your skeletal structure is shown as captured by the DEXA machine, with a color-coded density bar indicating mineral concentration across regions.
The results table consolidates your whole-body BMD, T-score, Z-score, and percentile rankings in one place. This is the format commonly shared with healthcare providers for medical record-keeping.
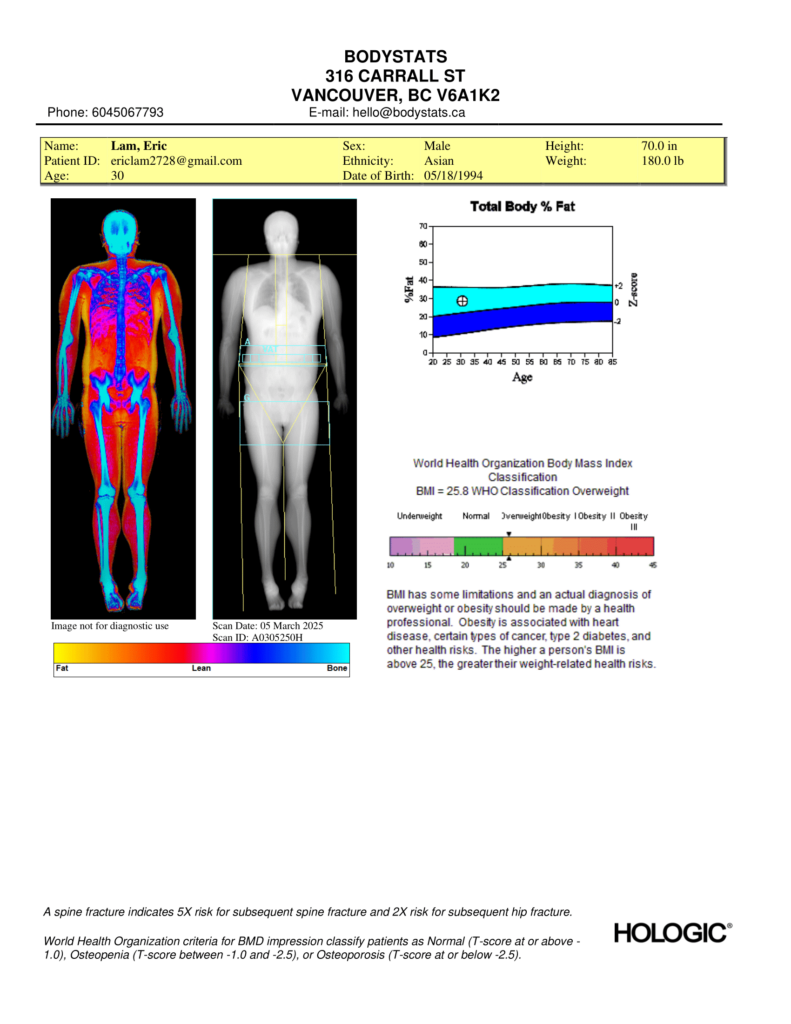
Clinical Page 5 — Body Composition Scan Image & BMI
The final clinical page features two powerful visuals. The full-body composition scan image shows fat, lean, and bone tissue in distinct colors across your entire body.
A Total Body % Fat chart plots your result against age-based reference data, and your BMI is mapped on the WHO classification scale.
While BMI alone can’t distinguish between muscle and fat, viewing it alongside your actual DEXA-measured body fat percentage gives you the full picture — and often reveals why BMI alone can be misleading.
Frequently Asked Questions About DEXA Scan Reports
How accurate is a DEXA scan compared to other body composition methods?
DEXA is the clinical gold standard for body composition analysis. It has a margin of error of roughly 1–2% for body fat measurement, compared to 3–5%+ for bioelectrical impedance scales, skinfold calipers, or BMI calculations. It’s also the only widely available method that measures bone density and regional body composition in a single scan.
What is a good body fat percentage?
This varies by sex, age, and goals. For men, essential fat is around 2–5% and a “fitness” range is typically 14–17%. For women, essential fat is 10–13% and a fitness range is 21–24%. Your BodyStats report compares your result against real client averages — far more useful than generic charts.
How often should I get a DEXA scan?
We recommend every 8–12 weeks if you’re actively working toward a body composition goal. For general health monitoring, every 6–12 months is great. Scanning too frequently (e.g., every 2 weeks) won’t show meaningful changes because your body needs time to adapt.
Why does my DEXA body fat percentage seem higher than my smart scale?
Bioelectrical impedance scales (Withings, InBody, Fitbit) tend to underestimate body fat by 3–8% compared to DEXA. They estimate composition based on electrical resistance, which is affected by hydration, meal timing, and skin temperature. DEXA measures tissue directly with X-ray, so the number is far closer to reality.
Can I share my clinical report with my doctor?
Absolutely — that’s one of the reasons we include the full Hologic clinical output. The bone density report with T-scores and Z-scores uses the same format as hospital-based DEXA scans, and your doctor can incorporate these results directly into your medical record.
What should I do with my results?
Your report includes personalized recommendations based on your specific numbers. If you’d like to go deeper, you can book a review session where we’ll walk through every metric and help you build a plan around your goals — whether that’s fat loss, muscle building, improving bone health, or general wellness.
Ready to See Your Own Report?
A single 7-minute scan gives you more insight into your body than months of guessing. Get your full body composition analysis, bone density assessment, and personalized recommendations.
We continuously update our report template and information. The report you receive may include additional sections or updated formatting compared to what’s shown above.