

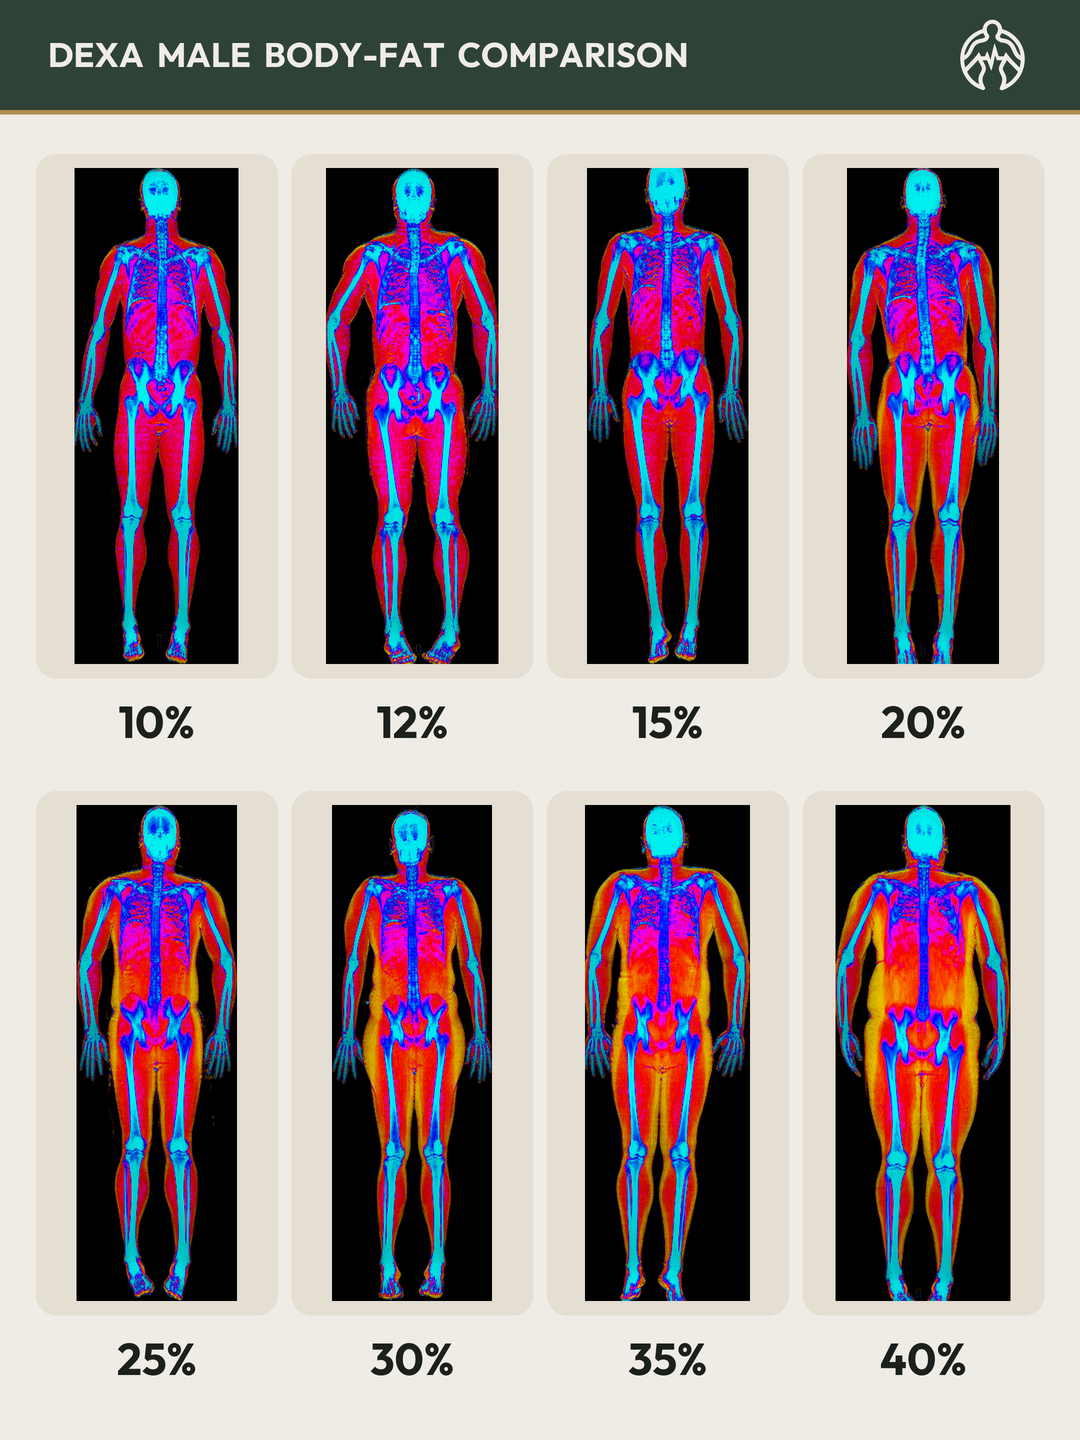
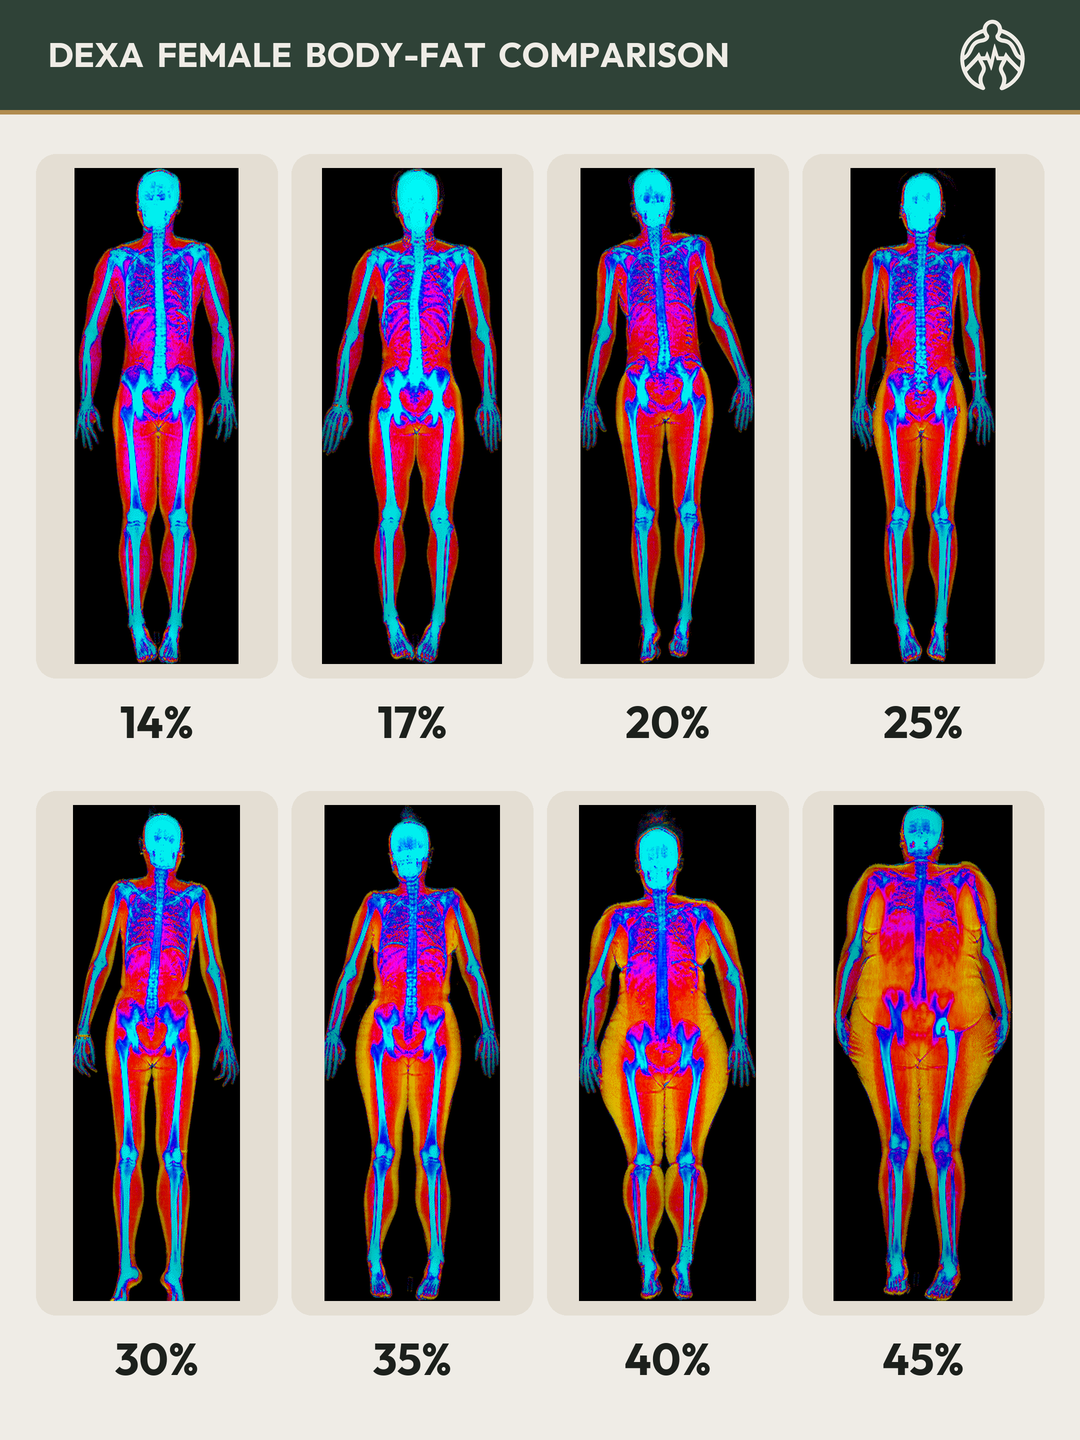
The most important DEXA number is your second one.
Don’t compare yourself to the chart. Compare yourself to yourself.
The chart above is for context, not for ranking. None of those tiles is “where you should be.” The number you walk in with on day one isn’t an achievement and it isn’t a failure — it’s data, set by your genetics, your frame, your hormones, your age, and the last decade of your life. None of that is a choice. The starting line isn’t earned and it isn’t shameful.
Your second scan is the one that tells you something. The first scan is a snapshot. The second one is a trend.
What can move
- Visceral fat can drop meaningfully in 12–24 weeks of focused training and nutrition. This is the metabolically dangerous fat — the most important number to move.
- Total body-fat percentage typically shifts 1–3% over 3–6 months for most clients. Faster movement is possible but rarely sustainable.
- Lean-mass asymmetries (left arm vs right, left leg vs right) often correct in 8–12 weeks of targeted training.
- Regional distribution — trunk vs limbs, android vs gynoid — shifts gradually as your training and recovery patterns change.
What barely moves
- Bone mineral content changes slowly — usually meaningful only over 1–3 years.
- Frame size and skeletal proportions are fixed by your mid-20s.
The point is the delta. Scan now. Train, eat, sleep, and recover for 3–6 months. Scan again. The difference between the two reports is the only number that tells you whether what you’re doing is working. A photo can’t do that. A bathroom scale can give you weight, but weight alone hides muscle gain inside fat loss.
Suggested cadence: 3 months for hard training cycles or aggressive cuts, 6 months for general lifestyle change, 12 months for maintenance and longitudinal tracking.
Where you start doesn’t define you. Where you go does. The chart above shows the spectrum — but your line on the chart isn’t a fixed point. It’s a moving one.
Photos estimate. Scales estimate. DEXA measures.
If your DEXA reads higher than your scale, that’s the point.
Almost every BodyStats client walks in with a body-fat number already in their head — from a smart scale, a hand-grip device at the gym, a personal trainer’s eyeball estimate, or a viral photo chart. When DEXA comes back 4–8% higher, the first reaction is usually “is the DEXA wrong?”
It isn’t. The other methods were wrong — usually by a consistent amount, in a consistent direction. Here’s exactly why each one falls short, and what DEXA does differently.
VisualThe number depends entirely on whose eyes are looking.
If a personal trainer eyeballs you at 15%, a coach across the room might call you 18%, a stranger on the internet 22%. The number changes with the eyeballs. Add lighting, flex, tan, posture, and lens choice (a 24mm wide-angle stretches you, an 85mm flatters you) and the same body can read across a 10-point range depending on the conditions of the photo. Visual estimates aren’t a measurement — they’re a vibe.
BIA scalesThey only measure part of you.
The smart scale you stand on at home — Tanita, Withings, Renpho — sends a tiny electrical current up one leg and back down the other. It never reaches your trunk. The hand-grip devices at the gym (InBody, Omron) add an arm-to-arm path, which is why some setups have you grip handles and stand on plates. Even with both, the current takes the path of least resistance — usually skipping right past your abdomen. That’s a problem because abdominal fat (visceral fat) is exactly the part that matters most for your health.
The reading also drifts with hydration, recent meals, skin temperature, and time of day. Drink a glass of water — your “fat percentage” changes. Step on after a workout when you’re dehydrated — it changes again. None of that is measurement. It’s an estimate based on a formula calibrated to a population, not to you.
DEXAIt actually measures — region by region.
A DEXA scan passes two low-dose X-ray beams through your entire body, head to toe. Different tissues absorb different amounts of energy: bone absorbs the most, muscle and lean tissue less, and fat the least. The scanner reads how much energy made it through every pixel and assigns each one to a tissue type.
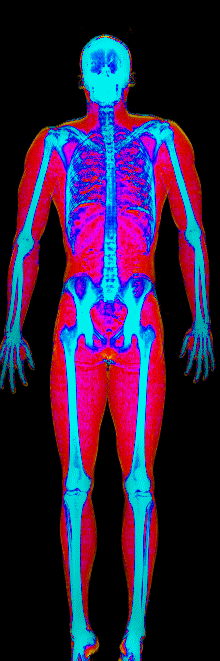
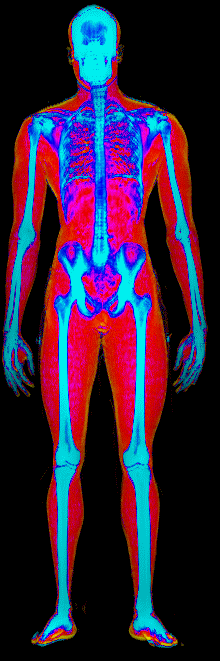
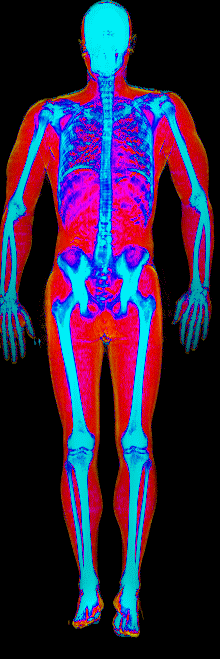
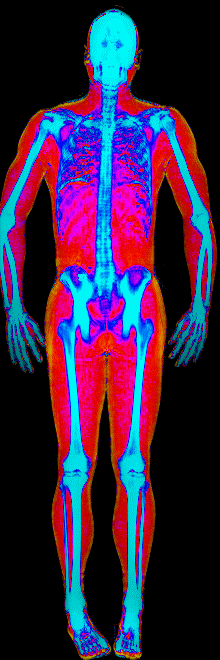
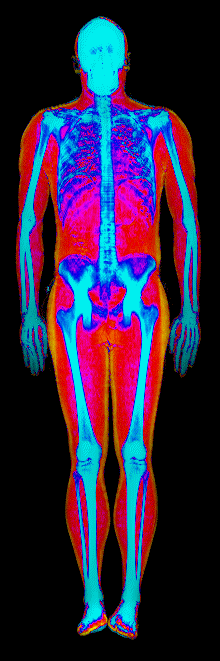
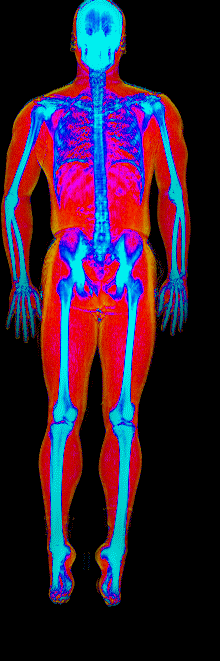
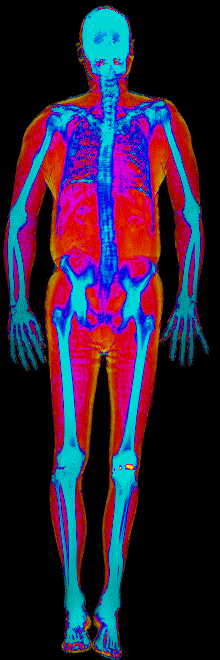
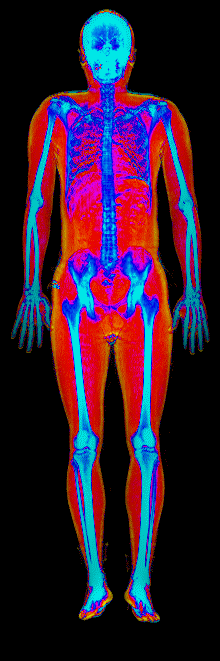
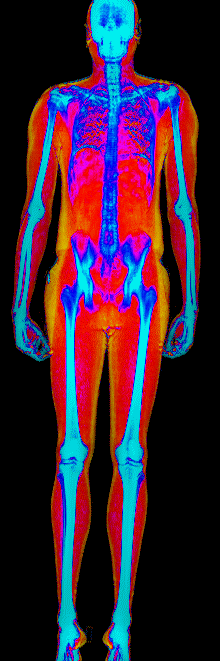
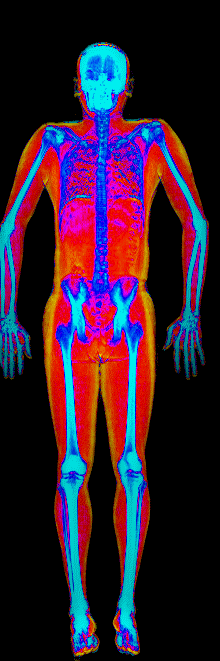
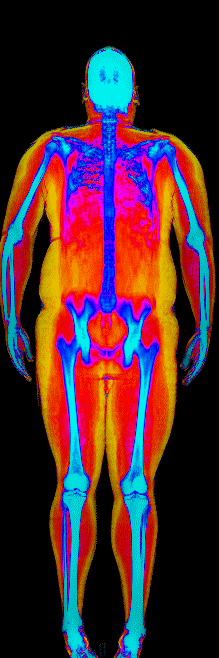
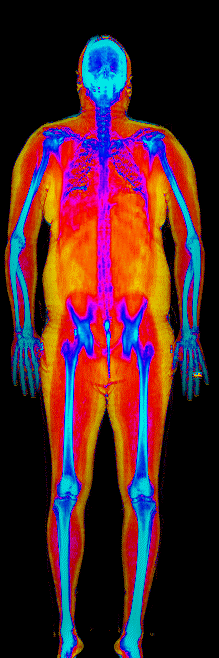
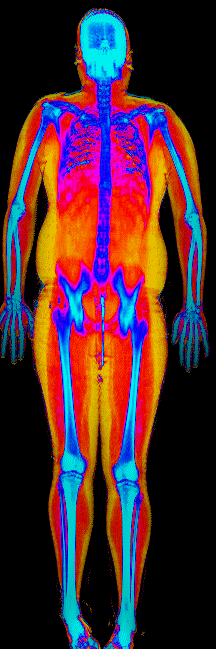
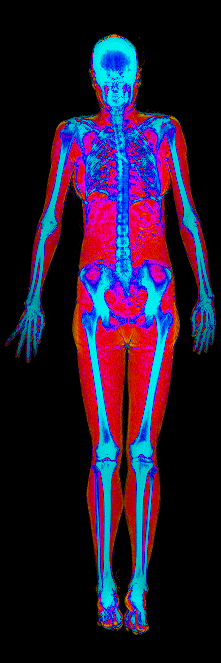
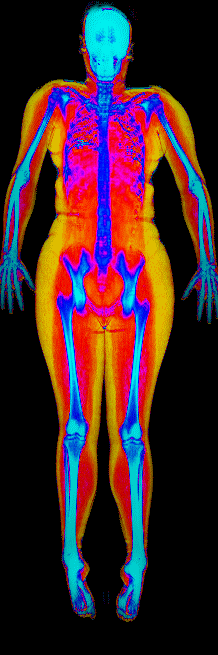
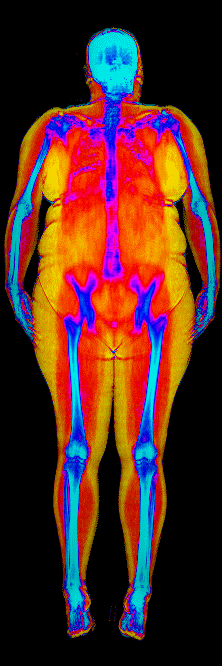
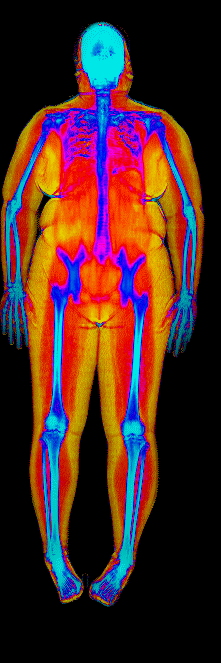
The colorful image at the top of every BodyStats DEXA report is literally that map. Bone shows up in cyan and white. Lean tissue is red. Fat is yellow and orange. Your body-fat percentage isn’t an inference — it’s a count of how much of that image is yellow and orange, broken out region by region: left arm vs right, left leg vs right, trunk, android (belly), gynoid (hips). And visceral fat — the dangerous abdominal fat that bioimpedance can’t see at all — comes back as its own number in cm².
That’s the difference. Visual methods see the surface. Bioimpedance sees a slice. DEXA sees everything.
| Method | How it works | Typical reading vs DEXA |
|---|---|---|
| Smart bathroom scale Tanita, Withings, Renpho, etc. |
Estimates fat from electrical resistance through the legs | 4–8% lower |
| Gym BIA device InBody, Omron hand-grip |
Estimates fat from resistance through arms or full body | 3–7% lower |
| Photo chart / visual estimate | Eyeballed against flexed, lit, tanned reference photos | 3–8% lower |
| Skinfold calipers trained operator, 3–7 sites |
Pinches subcutaneous fat, estimates total via formula | 2–5% lower |
| DEXA scan | X-ray attenuation, tissue by tissue, measured | The reference |
The translation, if you want one: if you’ve been training off a smart scale or gym InBody at 17%, your DEXA is likely landing somewhere between 22–25%. That’s not a setback — that’s the first time you’ve seen the real number. Train against it.
DEXA has a roughly ±1% measurement uncertainty and won’t replace a thoughtful training program — but of every body-composition method available outside of a research lab, it’s the most accurate, the most repeatable, and the only one that breaks fat down by region and reports visceral fat (the metabolically dangerous abdominal fat) as its own number.
The full guide follows below.
How to Use This Guide
This page features real, anonymized DEXA scan images from BodyStats clients, organized by gender and body fat percentage in 5% increments. DEXA (Dual-Energy X-ray Absorptiometry) is the clinical gold standard for measuring body composition — far more accurate than scales, calipers, or visual estimates.
Each colorized scan shows the distribution of fat tissue (shown in warmer colors) and lean tissue (cooler colors) throughout the body. Compare your own DEXA scan to others in your range, or see what different body fat levels actually look like on a scan.
Male DEXA Scans by Body Fat %
10 to 15% body fat
15 to 20% body fat
20 to 25% body fat
25 to 30% body fat
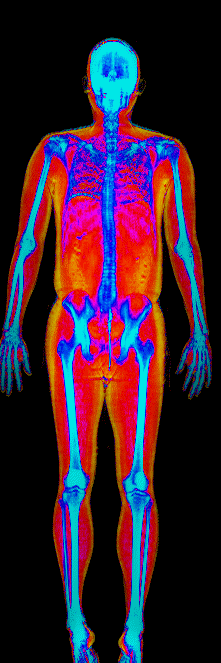
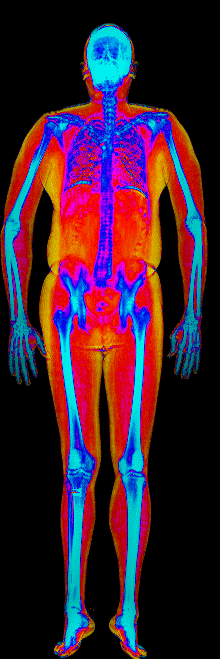
30 to 35% body fat
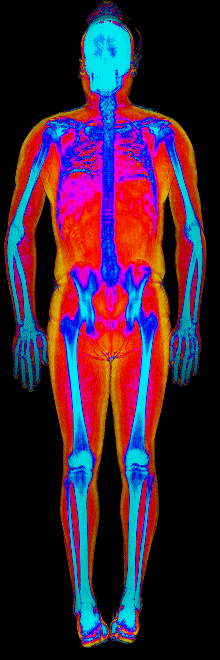
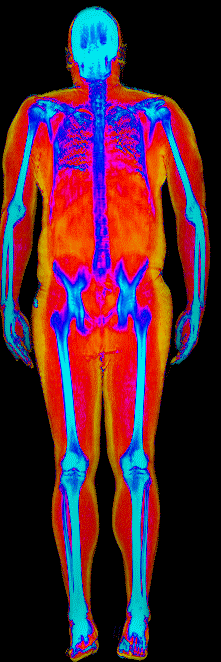
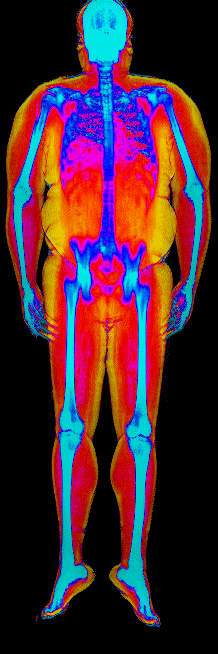
35 to 40% body fat
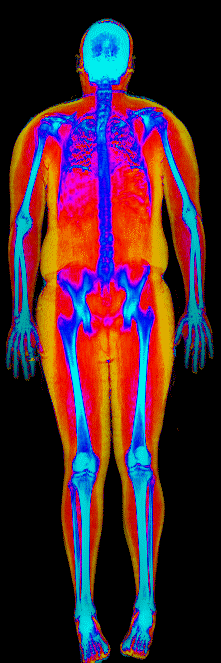
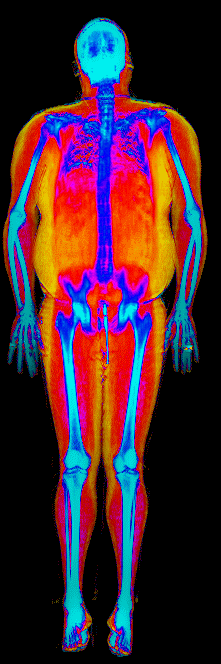
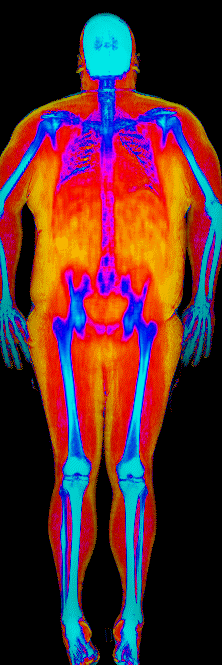
40 to 45% body fat
Female DEXA Scans by Body Fat %
15 to 20% body fat
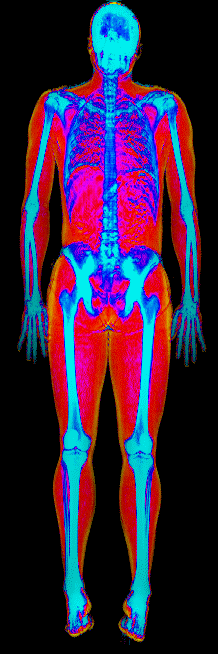
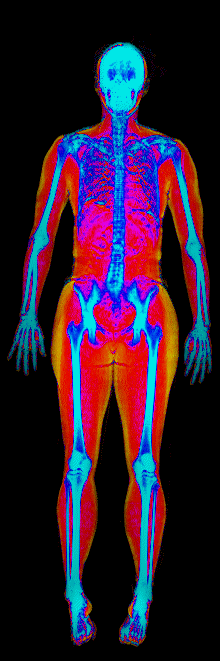
20 to 25% body fat
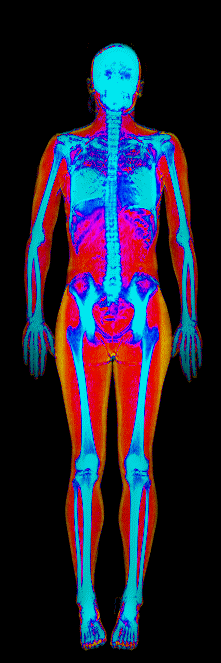
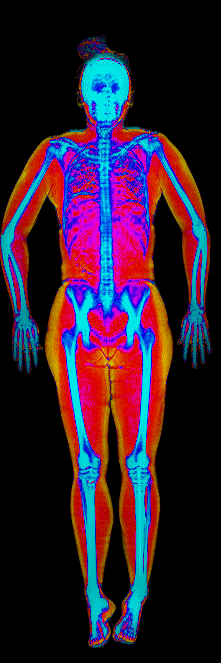
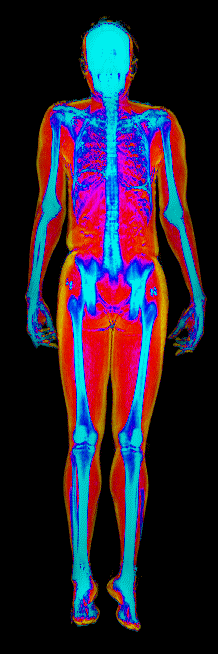
25 to 30% body fat
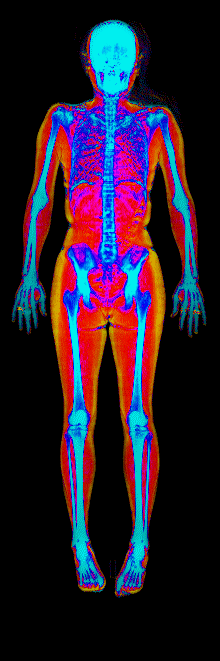
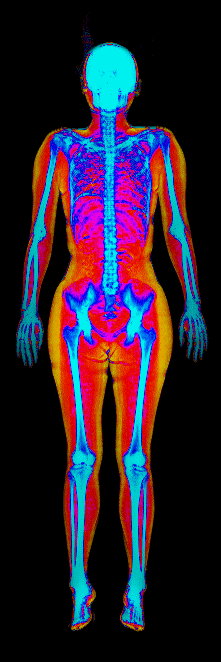
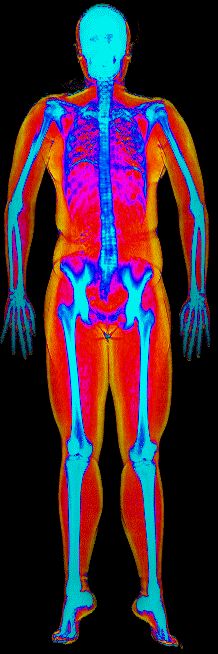
30 to 35% body fat
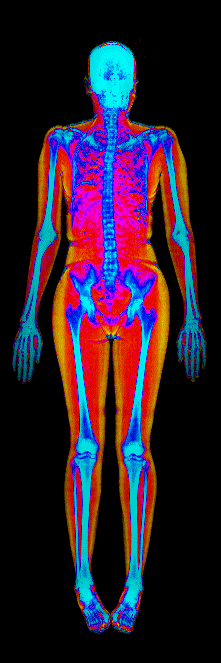
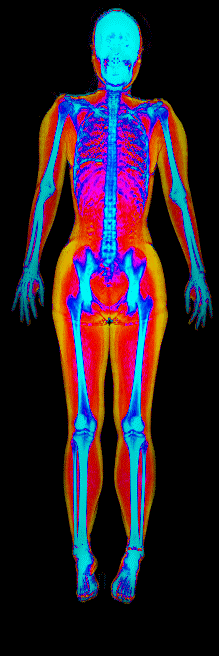
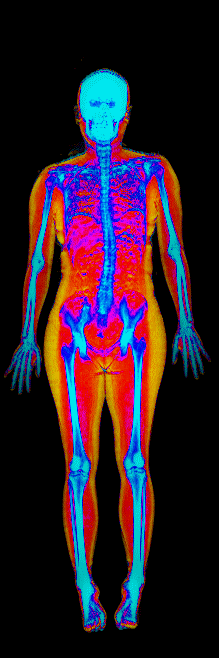
35 to 40% body fat
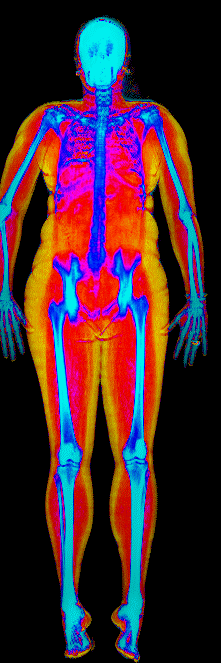
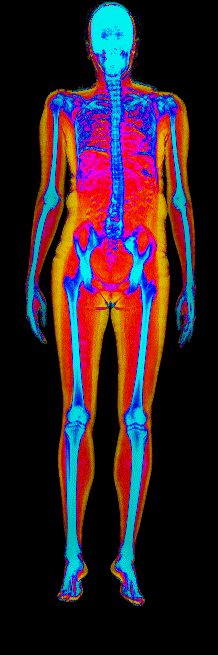
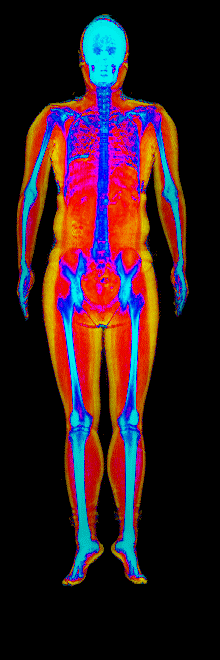
40 to 45% body fat
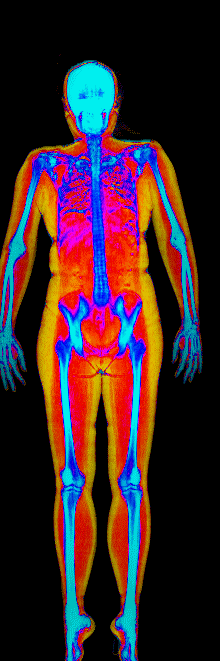
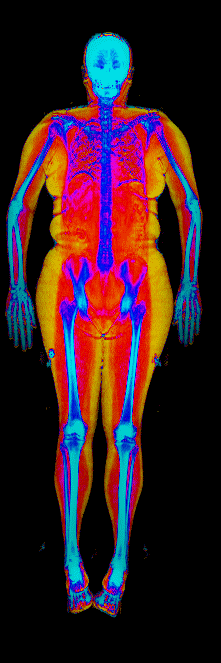
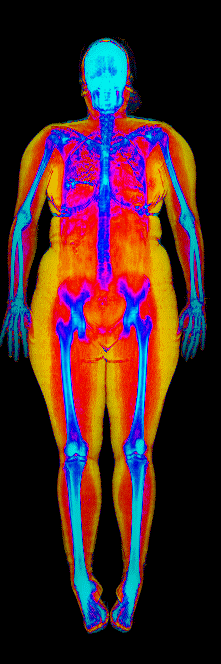
45 to 50% body fat
Want to Know Your Real Numbers?
Stop guessing and get high precision. A DEXA scan at BodyStats gives you your exact body fat percentage, lean mass, bone mass, visceral fat measurement, and a full regional breakdown — all in under 15 minutes.
Want to understand the methods behind these numbers? Read Different Ways to Measure Body Fat.
See what body composition changes actually look like: our clients’ Top 10 body transformations.
And find out how body fat percentage is measured and which methods are most accurate.