

This is the second open-data report we’ve published from the BodyStats scan database. The first looked at body composition during weight loss. This one looks at the inverse: what bodies actually do during weight gain.
A note up front, because it changes how you read the table. “Gain” in our dataset does not necessarily mean “structured bulk.” It means any period where fat mass was trending upward from a previous trough — which includes intentional surplus phases, but also detraining periods, holidays, injury recovery, and life-happening stretches. Read the numbers with that range in mind.
What we did
Same methodology as the cut report, inverted. We pulled every BodyStats customer with two or more DEXA scans (1,499 people, 8,981 scans), identified weight-gain periods (intervals where fat mass climbed from a trough), and averaged the month-by-month change in fat and lean mass while the gain was active.
- The first 30 days are excluded — early “gain” is dominated by water, glycogen, and sodium-driven scale movement, not real tissue.
- A gain “ends” the moment fat mass drops back below the starting trough.
- All scans on the same Hologic Horizon W. 343 men and 217 women contributed gain periods.
- Tables show median (typical customer) and mean (AVG, including outliers).
Median male fat & muscle change during gain
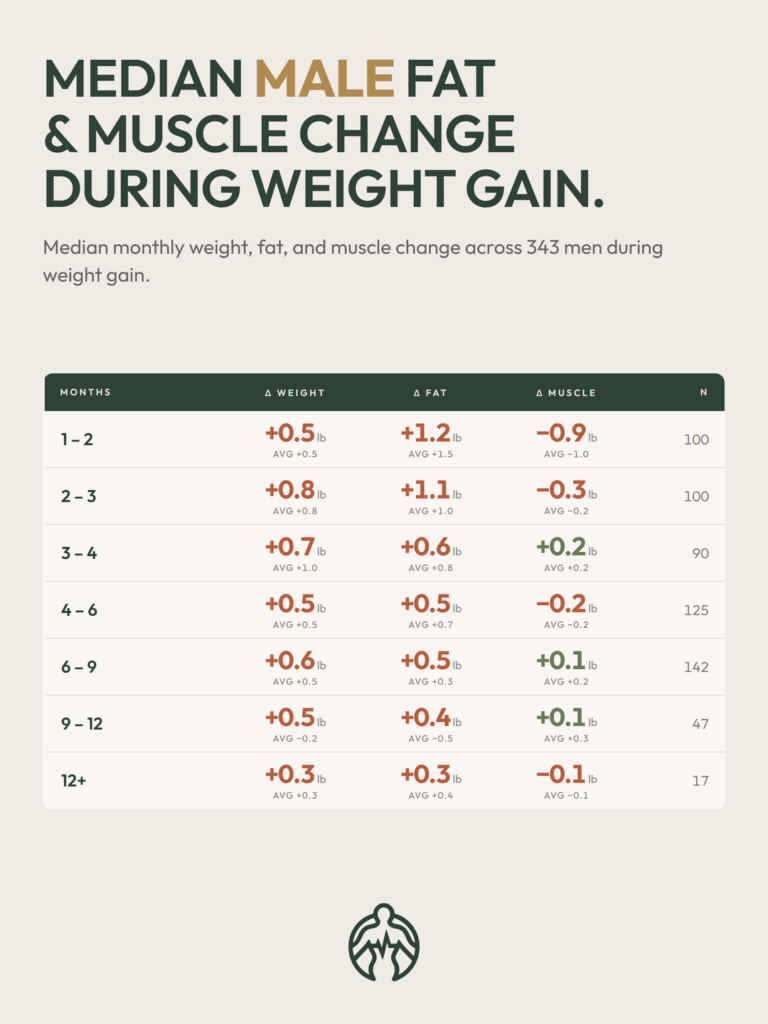
The first two months of a gain typically show muscle loss, not gain. The median man drops 0.9 lb of muscle per month while gaining 1.3 lb of fat. That’s the detraining signature — someone falling off training and eating more shows up in the data as a fat increase, and what they lose first is muscle.
The muscle column turns positive around month 3–4 (+0.2 lb/mo). That’s where intentional bulks and recomp efforts probably enter the dataset — people doing something deliberate with the surplus instead of drifting.
Fat-gain rate slows month by month, the same way fat-loss rate slowed during cuts. The body adapts in both directions.
Median female fat & muscle change during gain
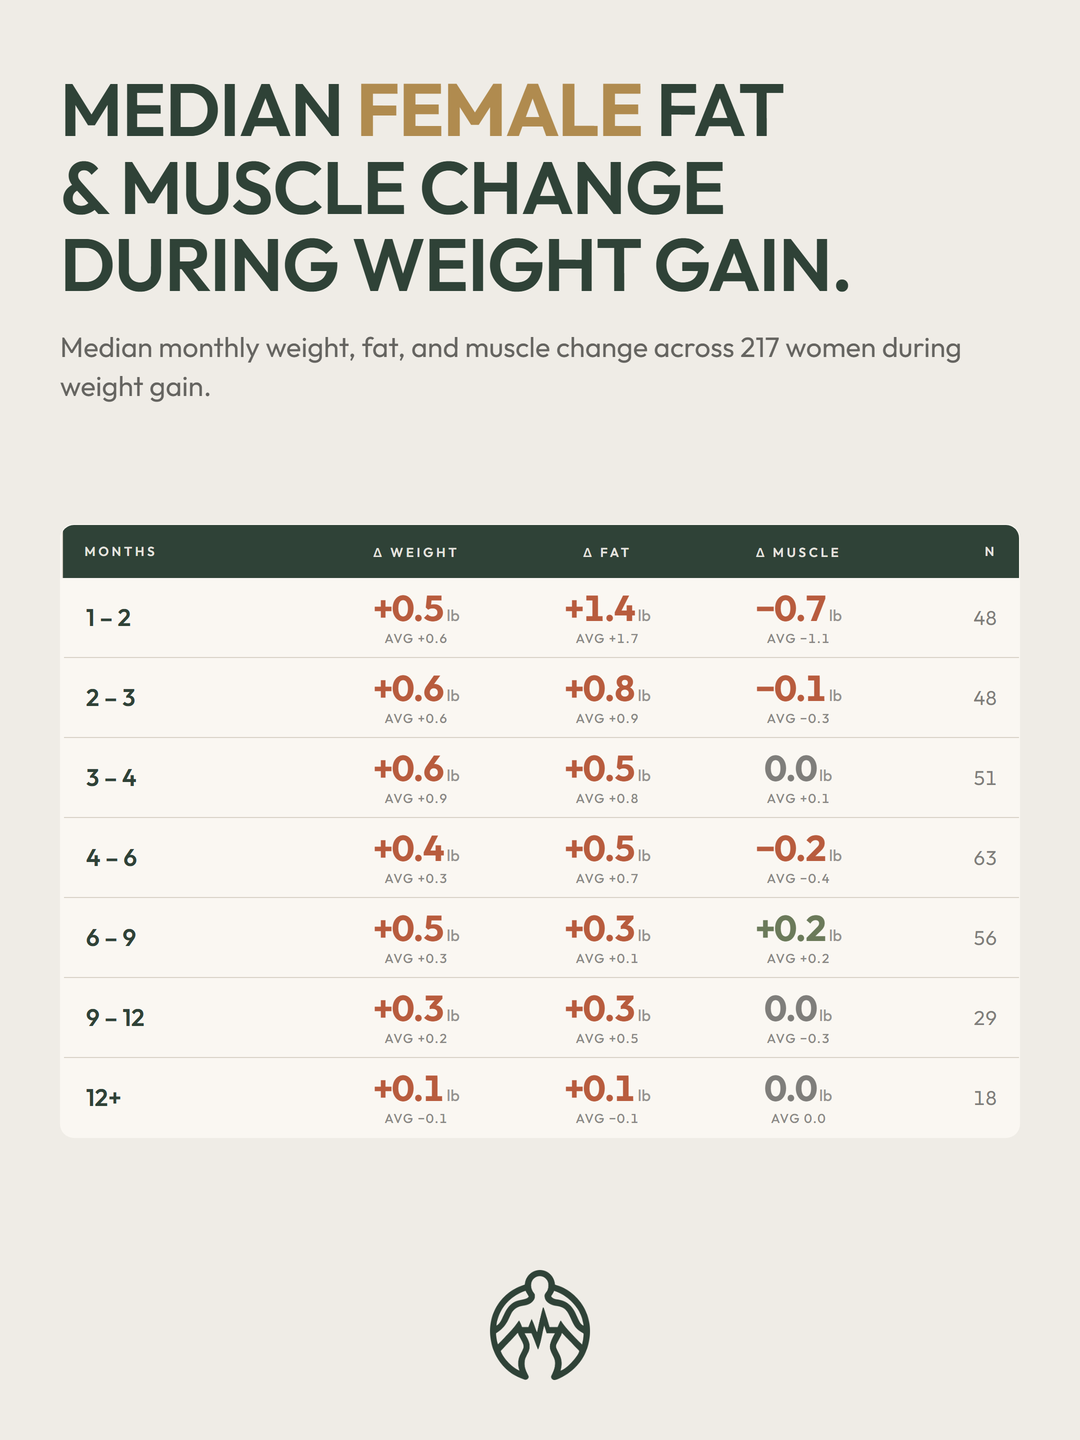
Same overall shape. Early gain is muscle-down, fat-up — the detraining pattern. The muscle column turns clearly positive a little later than for men: month 6–9 (+0.2 lb/mo).
Two reads on that delay are possible: women take longer for hypertrophy responses to show on a scan (likely contributor), or women in this dataset are less commonly running deliberate surplus phases. We can’t separate those from the data alone.
A few notes
- “Gain” is a loose category here. A textbook bulk and a holiday week-of-eating both land in this dataset. We don’t separate intent from outcome.
- Sample sizes are smaller than the cut report. 343 men and 217 women contributed gain periods — fewer than the ~900/600 in the cut data. Wider confidence intervals.
- Detraining is real and shows up early. If you’re starting a gain phase and want to avoid the month 1–2 muscle drop, the data suggests training continuity matters more than calorie strategy.
- This is the average across all gain types. A structured surplus done well would beat these numbers; a holiday without training would be worse.
What we’ll look at next
We’re publishing what we find as we find it. There’s a lot still to look at: recomp episodes, visceral fat trajectories, age and training-experience cohorts, what happens during a maintenance phase, how scan-to-scan body comp moves correlate with hours-of-sleep when we can pair it with wearable data.
If there’s a pattern you want us to dig out, comment on the Instagram post (@body.stats) or send a note. We’ll pull what we can pull.
Our mission is to make advanced health tracking available to everyone. That includes the knowledge we gain along the way.