

Our mission at BodyStats is to make advanced health tracking available to everyone. Part of that mission is sharing what we find — not just the printout in your hand, but the patterns that show up when we look across thousands of customers.
Most DEXA studios scan you, hand you a report, and you walk out. We keep the data. When someone comes back for a second, third, or tenth scan, we can do something most clinics can’t: watch how a real body changes over time. So we did.
What we did
We pulled every BodyStats customer who has had two or more DEXA scans with us — 1,499 people, 8,981 scans in total. From each customer’s timeline, we identified weight-loss periods (intervals where fat mass had dropped from a previous peak), then averaged the month-by-month change in fat and lean (muscle) mass while the cut was still active.
A few notes on the methodology:
- The first 30 days of any cut are excluded. Early “fat loss” is dominated by water and glycogen — not real tissue change — and we didn’t want that noise in the per-month rates.
- A cut “ends” the moment fat mass exceeds the customer’s starting peak. Rebounds aren’t folded into the cut average.
- Every scan is on the same Hologic Horizon W machine. No cross-device noise.
- We report both the median (the typical customer) and the mean (the average customer). They tell different stories — see below.
Of those 1,499 customers, 958 had at least one weight-loss period — 588 men and 370 women — yielding 991 distinct cut episodes and 1,790 monthly intervals (1,193 male, 597 female), all measured on the same equipment.
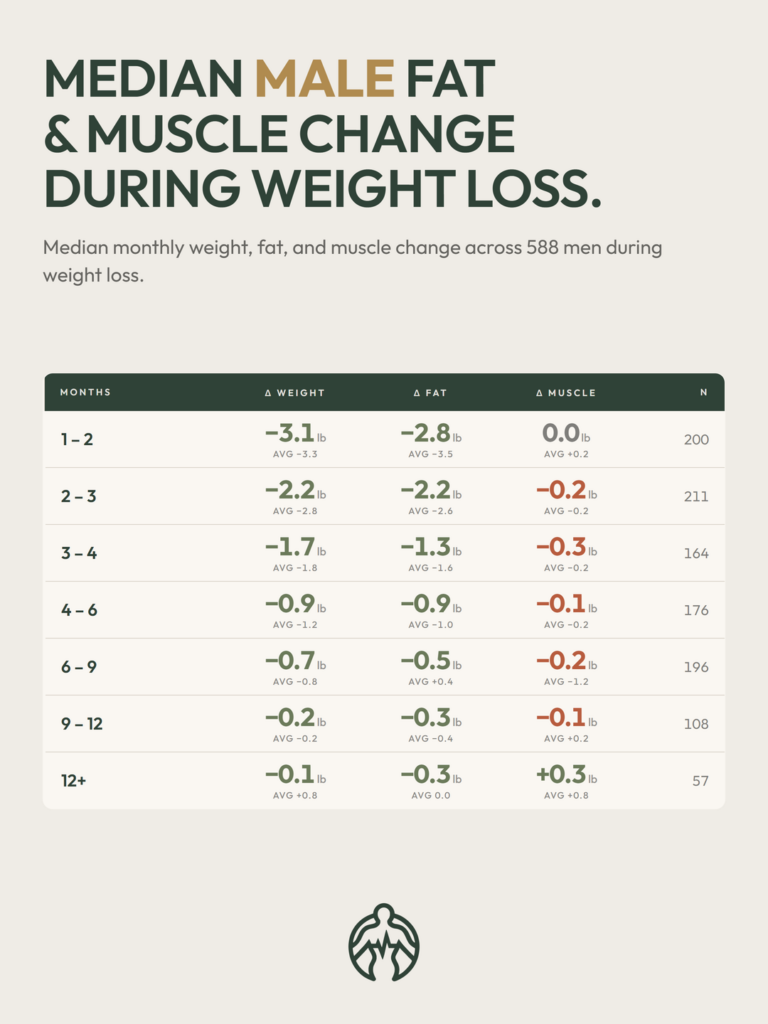
Median male fat & muscle change
588 men contributed to this view. Large number = the median (typical customer). Smaller “AVG” number underneath = the mean (the average outcome, including outliers).
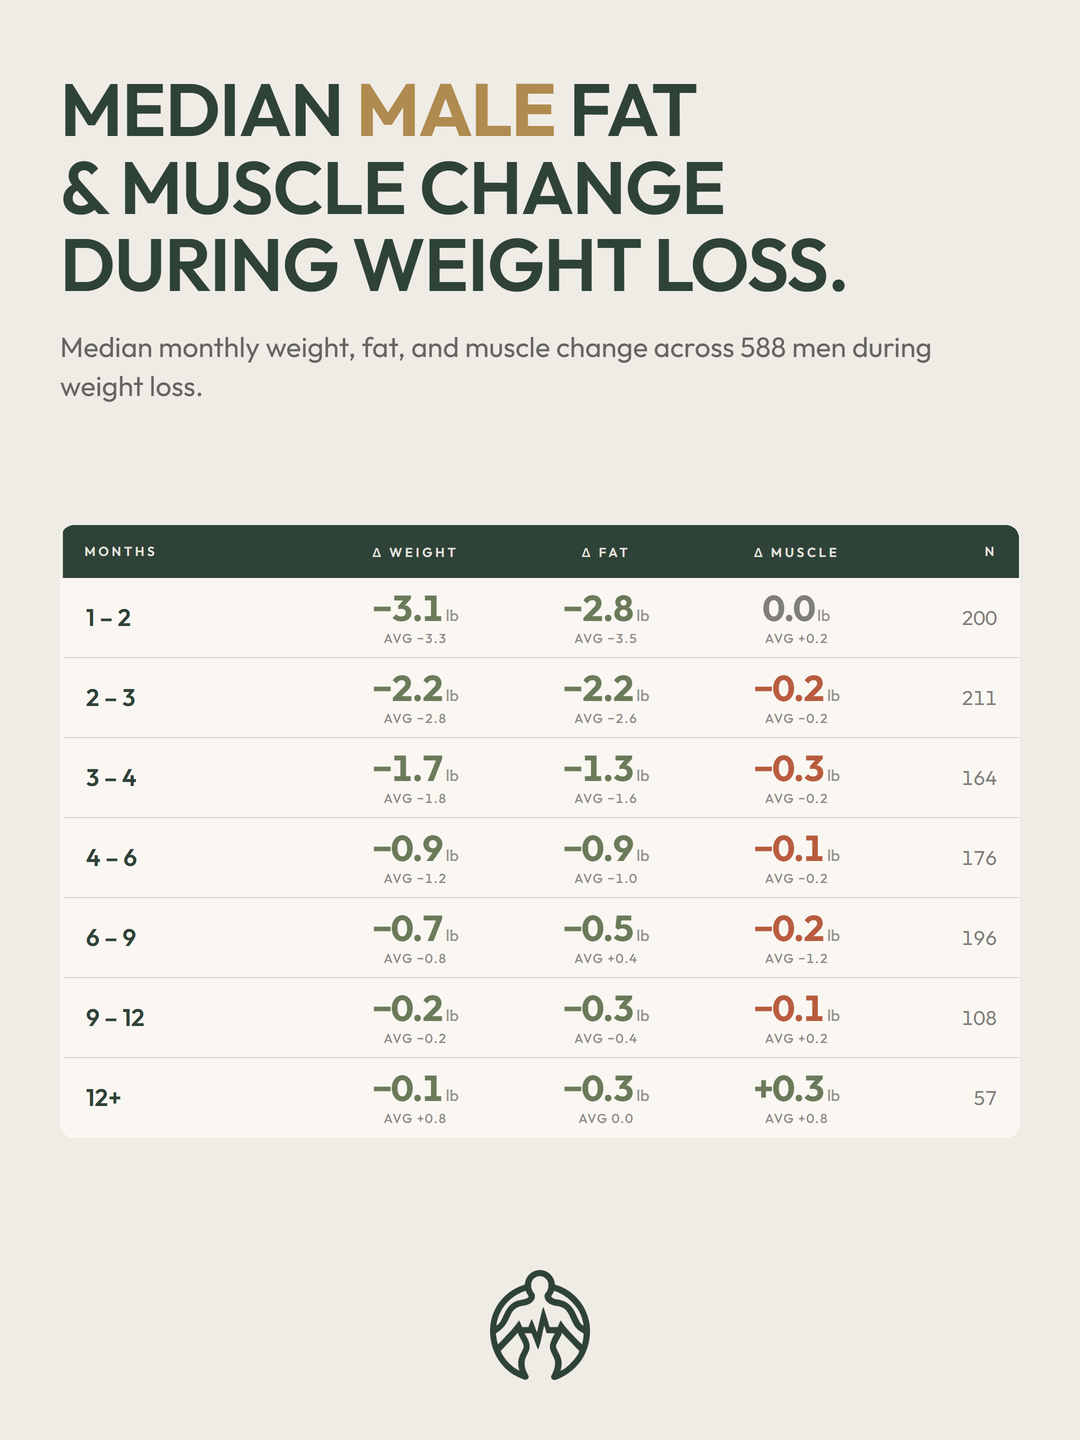
Fat-loss rate declines steadily — fastest in the first two months, decelerating each month after. The typical man (median) keeps losing some fat through the 12+ month bucket, but at a fraction of the early rate.
Muscle change stays modest throughout. The median lifter loses about 0.1 to 0.3 lb of muscle per month during a cut — small enough that on any given month it could be measurement noise.
Watch the gap between median and mean at month 6–9. The median says fat loss has slowed to −0.5 lb/mo. The mean says it’s reversed to +0.4 lb/mo. The mean is being pulled by a long tail of customers whose cuts stalled out hard or rebounded. The typical experience and the average experience diverge at this point — both are real outcomes. If your scans look like the median, you’re in the company of most cutters. If they look like the mean, you’ve hit a wall most don’t.
Median female fat & muscle change
370 women, same treatment:
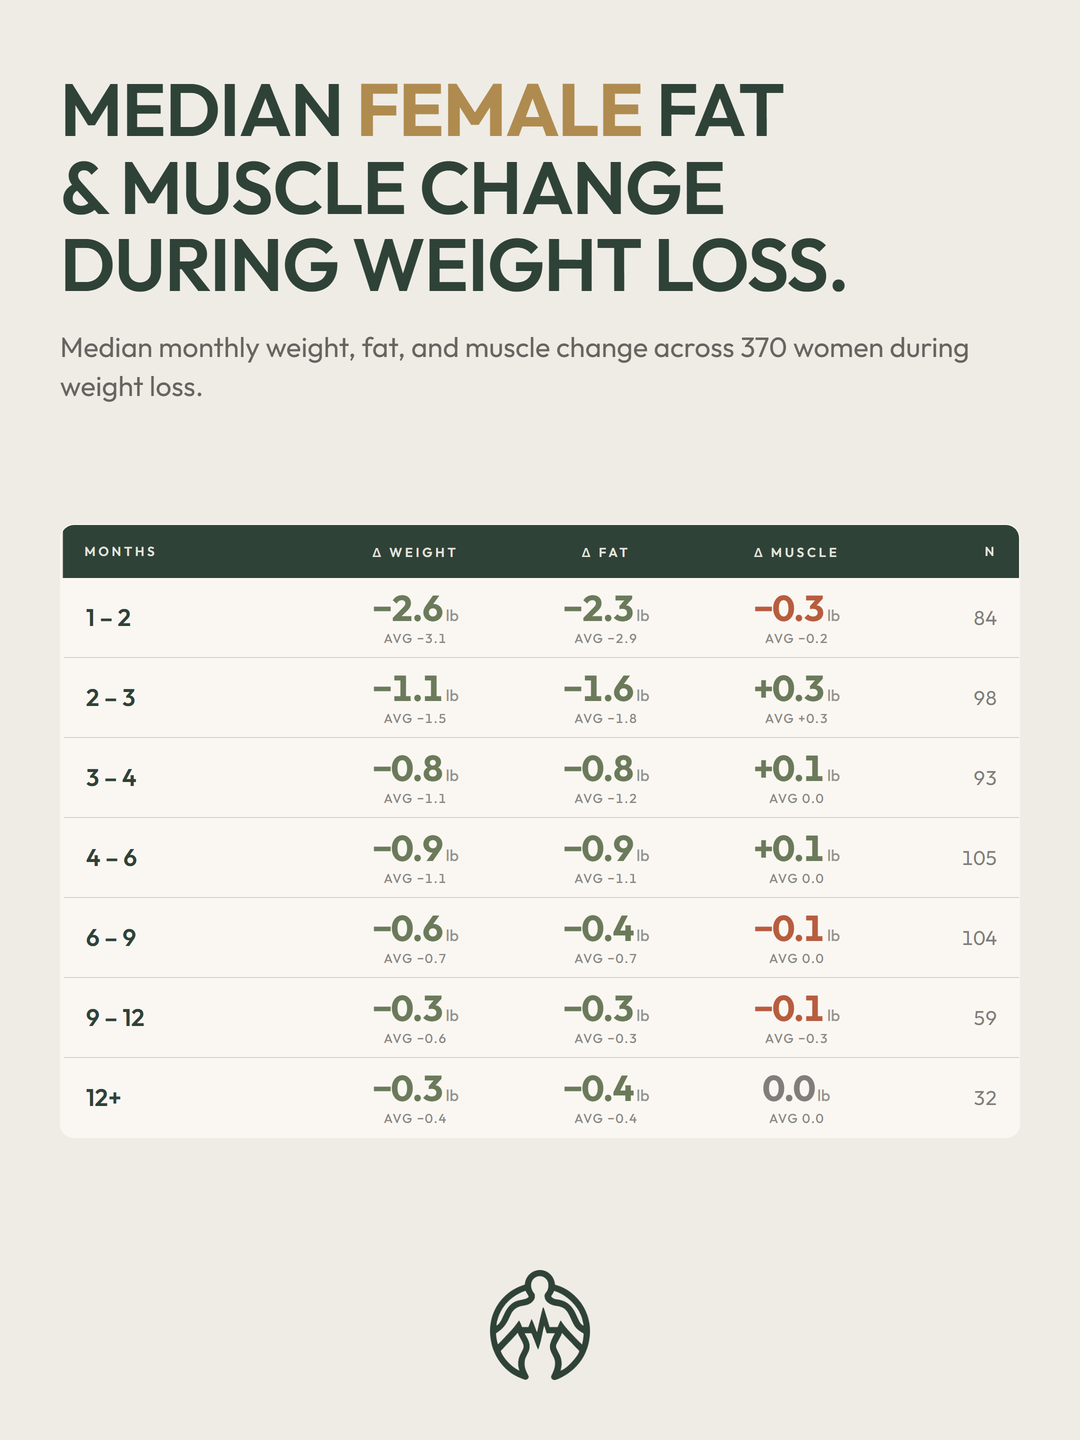
The fat-loss curve has the same shape — fast early, slowing each month — but flatter. Where the men’s data has a sharp gap between median and mean at month 6–9, women’s stays tight. Median and mean are almost on top of each other. That means less variance: the typical female outcome is the average female outcome.
Muscle change stays effectively at zero across nearly every bucket studied. Whether that’s hormonal protection, lower absolute lean mass, or a more engaged training base — we can’t say from this data. But the signal is consistent.
A few notes on what you’re looking at
These are averages, not individual outcomes. A few other things worth knowing:
- Customers who come back are an engaged group. They probably train and eat more deliberately than the average dieter. “What works on average” here is filtered through that.
- We don’t have nutrition or training logs alongside the scans. We can see what changed; we can’t say why.
- “Cutting” here means losing fat below a previous peak. Not a structured deficit, not a coach’s program — just the body composition moving downward.
- Use median first. Mean is informative but vulnerable to outliers, especially in smaller buckets (the 12+ month bucket for men has only 57 intervals — one or two extreme readings move the mean visibly).
None of that invalidates the picture. It does mean a single average shouldn’t override what your own scans are telling you.
What we’ll look at next
This is the first of what we’d like to be a regular thing — pulling questions out of our own data and answering them in the open. There’s a lot we haven’t looked at yet: age bands, training-experience cohorts, recomp versus pure cut, regional fat distribution, what happens during a maintenance phase, what happens during a recomposition attempt, how visceral fat moves separately from total fat. The list is long.
If there’s something you want to see, tell us. Leave a comment on the Instagram post that goes with this article (@body.stats), or reach out directly. We’ll pull what we can pull.
Our mission is to make advanced health tracking available to everyone. That includes the knowledge we gain along the way.