
We tested 646 clients with both a VO2 max test and a DEXA body composition scan. Then we cross-referenced the results with self-reported exercise habits and regional muscle data from arms, legs, and trunk.
No opinions. Just data. Here’s what high cardiorespiratory fitness actually looks like under the skin.
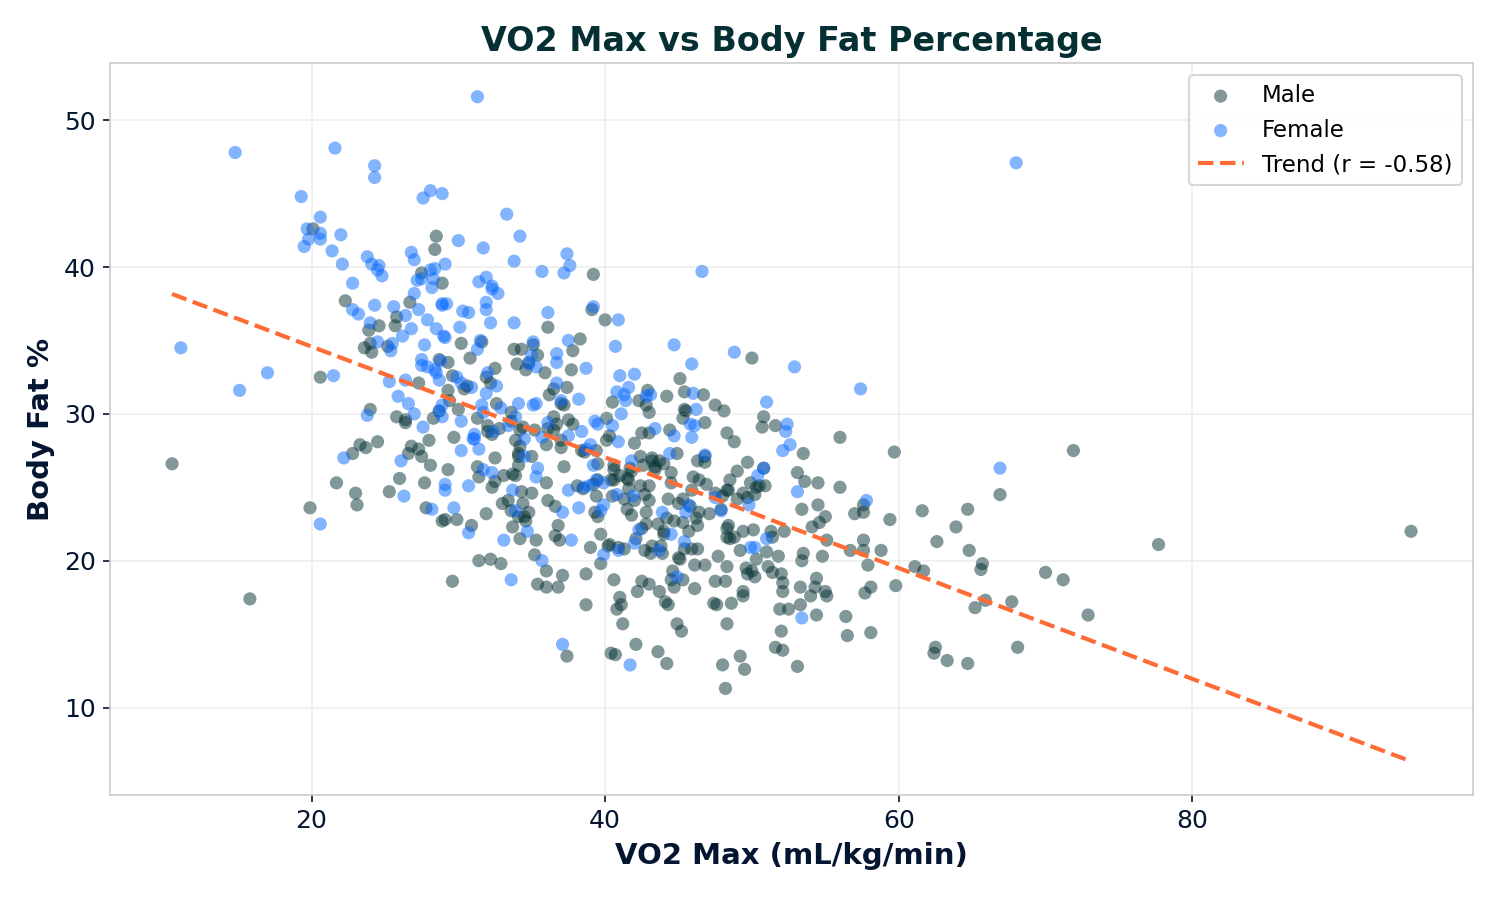
The Big Picture: VO2 Max vs Body Fat
The correlation is strong and statistically significant (r = -0.58, p < 0.001). Higher VO2 max = lower body fat percentage, consistently across 646 individuals.
Top 25% vs Bottom 25%
We split our dataset into quartiles by VO2 max score. The differences between the top and bottom groups are significant across every metric.
| High VO2 (≥46) | Low VO2 (≤31) | Difference | |
|---|---|---|---|
| Avg VO2 Max | 54.0 | 26.3 | +27.7 |
| Body Fat % | 22.1% | 33.4% | -11.3% |
| Visceral Fat | 391g | 569g | -47% |
| Lean/Height Ratio | 1.96 | 1.67 | +17% |
| Weekly Training Volume | 232 min | 135 min | +72% |
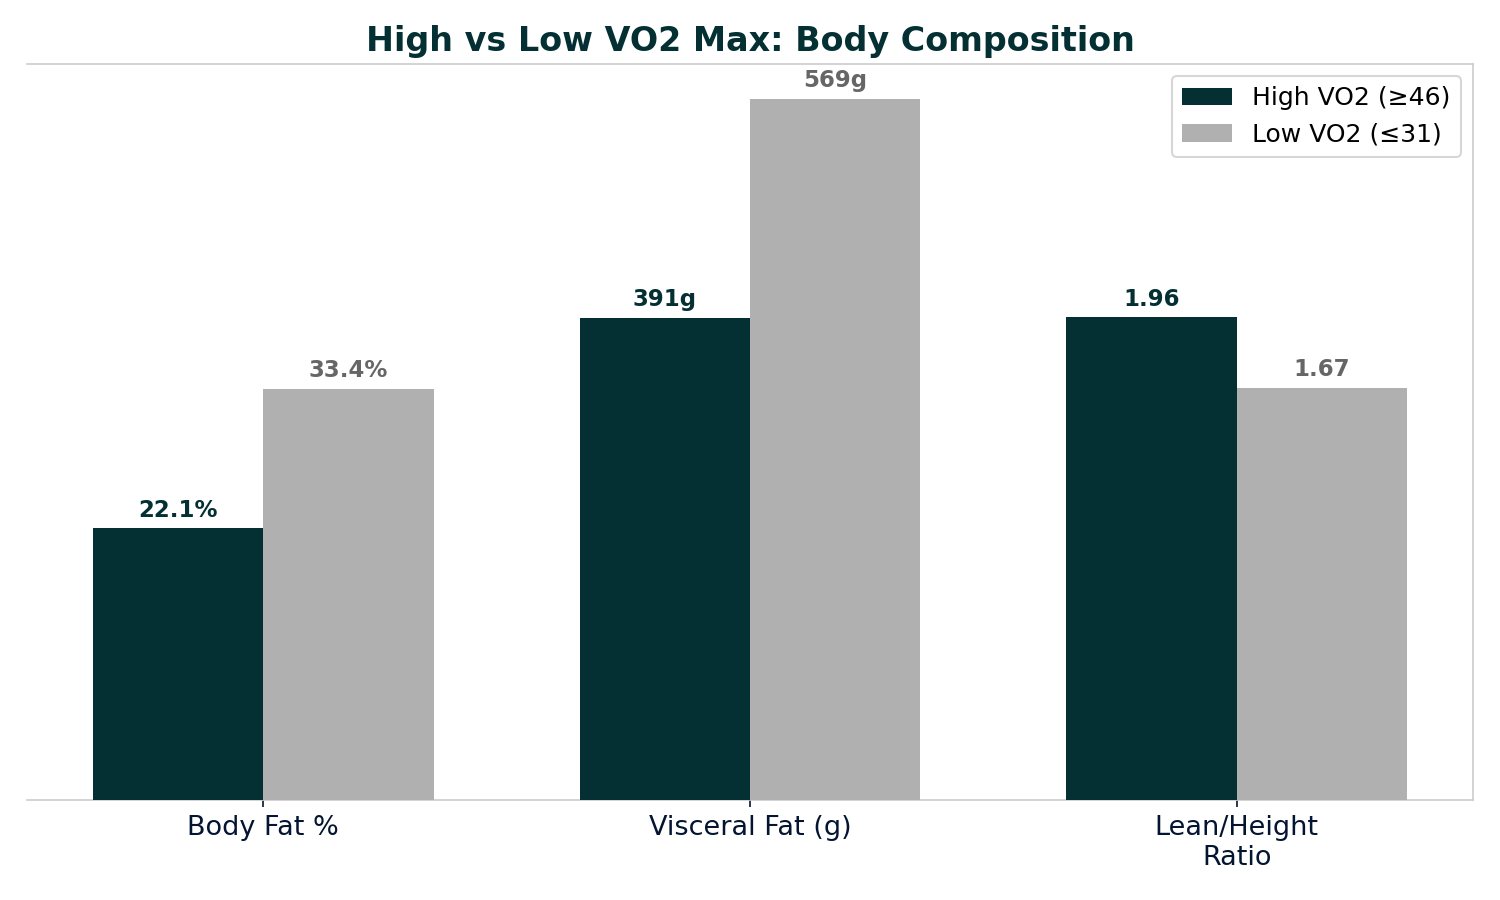
The top VO2 group carries 11 fewer percentage points of body fat and nearly half the visceral fat — the internal fat linked to heart disease, diabetes, and metabolic syndrome.
What It Looks Like on a DEXA Scan
Numbers are one thing. Seeing it is another. Here are actual DEXA scan images pulled from our database — comparing a client with one of the highest VO2 max scores against a client in the lower range.
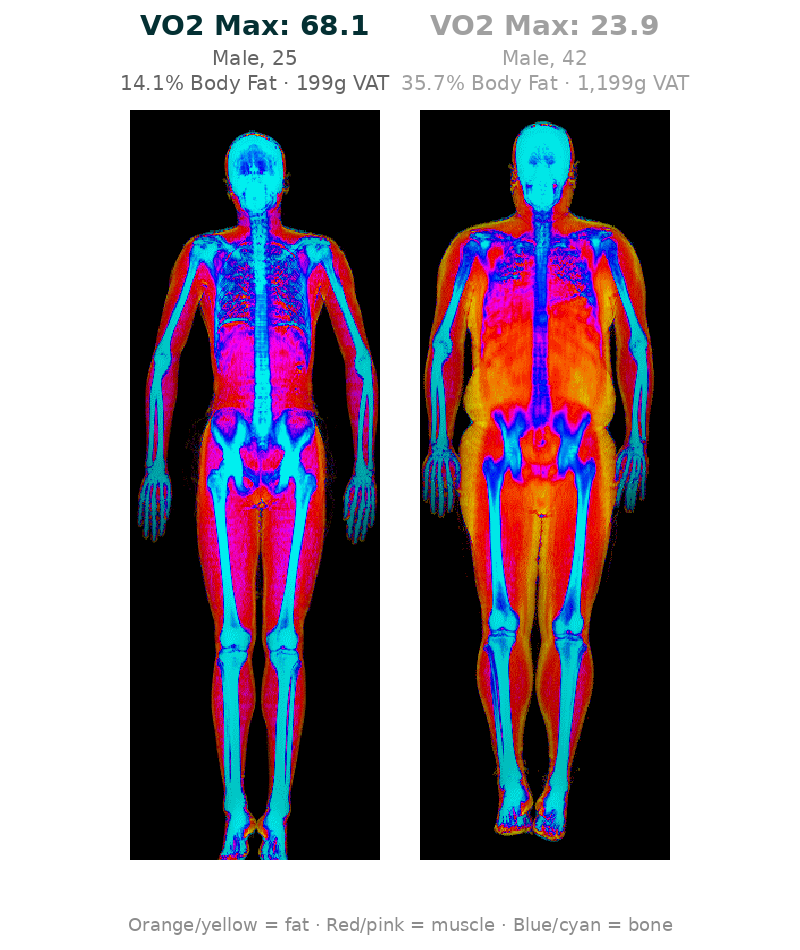
The difference in the orange/yellow fat layer is immediately visible — especially around the trunk, abdomen, and between the organs. The high-VO2 scan on the left shows a thinner fat layer with more defined muscle tissue (red/pink) throughout the limbs and core. The scan on the right shows substantially more subcutaneous and visceral fat, particularly in the midsection.
DEXA Scans of Our Top Athletes
Here are three of our highest-performing VO2 max clients. All scored well above average — putting them into the “superior” fitness category regardless of age or sex.
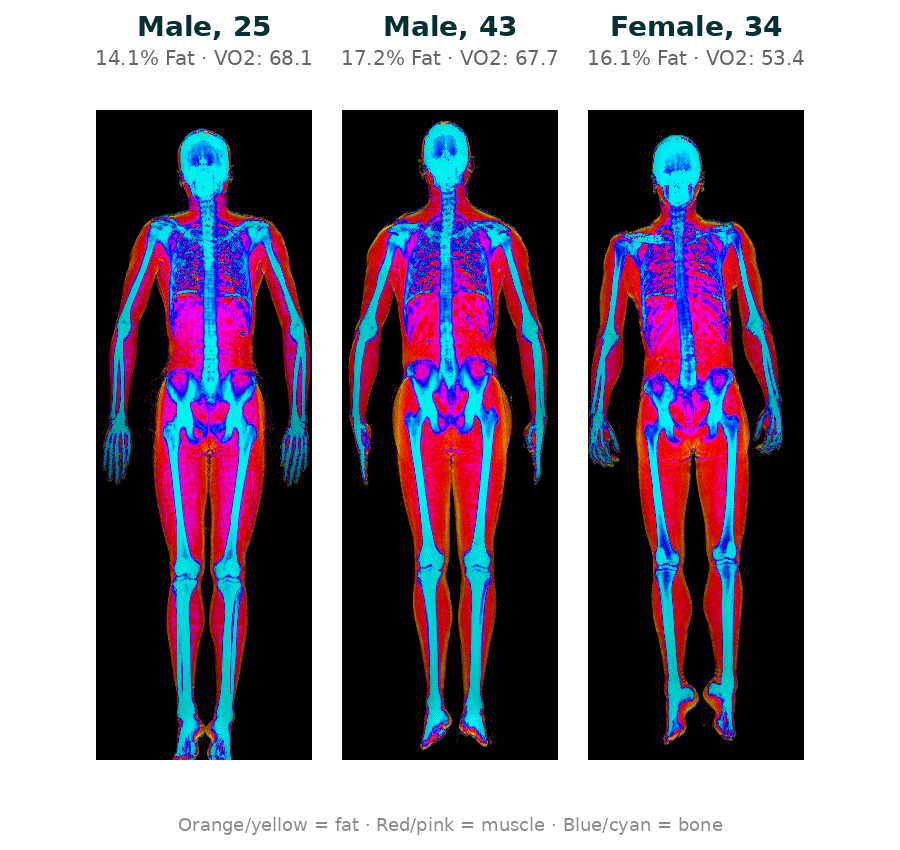
What stands out across all three: minimal orange/yellow fat around the midsection, well-defined muscle tissue in the arms and legs, and strong bone density (shown in bright cyan). The 43-year-old male in the center has 17.2% body fat and a VO2 max of 67.7 at an age where the average is closer to 35. The 34-year-old female on the right sits at 16.1% body fat — leaner than most males in our dataset.
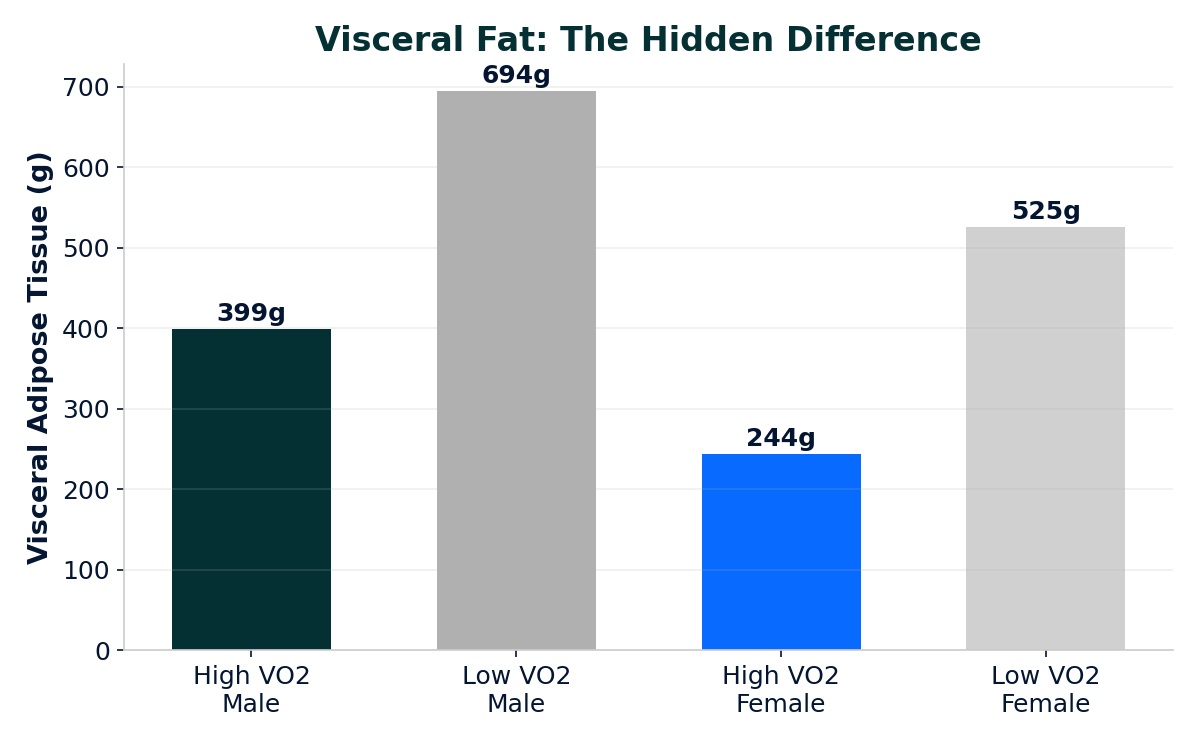
The Visceral Fat Gap
Visceral adipose tissue (VAT) surrounds your organs and drives chronic disease risk. It’s invisible from the outside — you can’t see it in a mirror or measure it with a scale. The gap between high and low VO2 groups is dramatic, and it holds for both men and women.
Arms, Legs, and Trunk: The Regional Breakdown
Using DEXA’s regional body composition data from 403 clients, we compared lean mass in the arms, legs, and trunk between high and low VO2 groups.
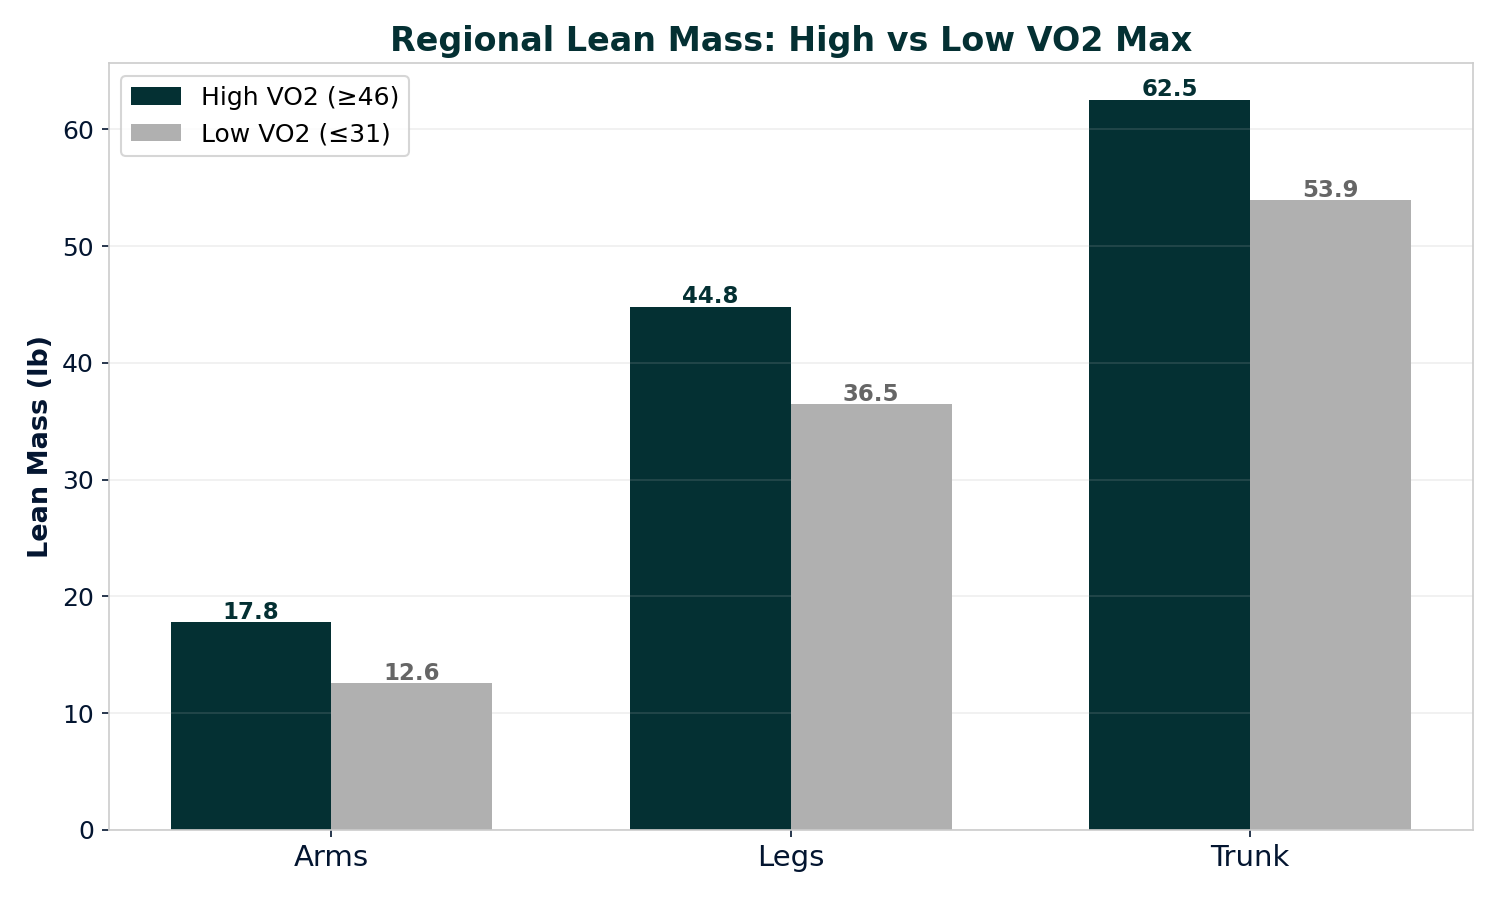
High-VO2 individuals carry 41% more arm lean mass (17.8 vs 12.6 lb), 23% more leg lean mass (44.8 vs 36.5 lb), and 16% more trunk lean mass (62.5 vs 53.9 lb). Higher cardiorespiratory fitness correlates with more muscle tissue everywhere — not just in the legs.
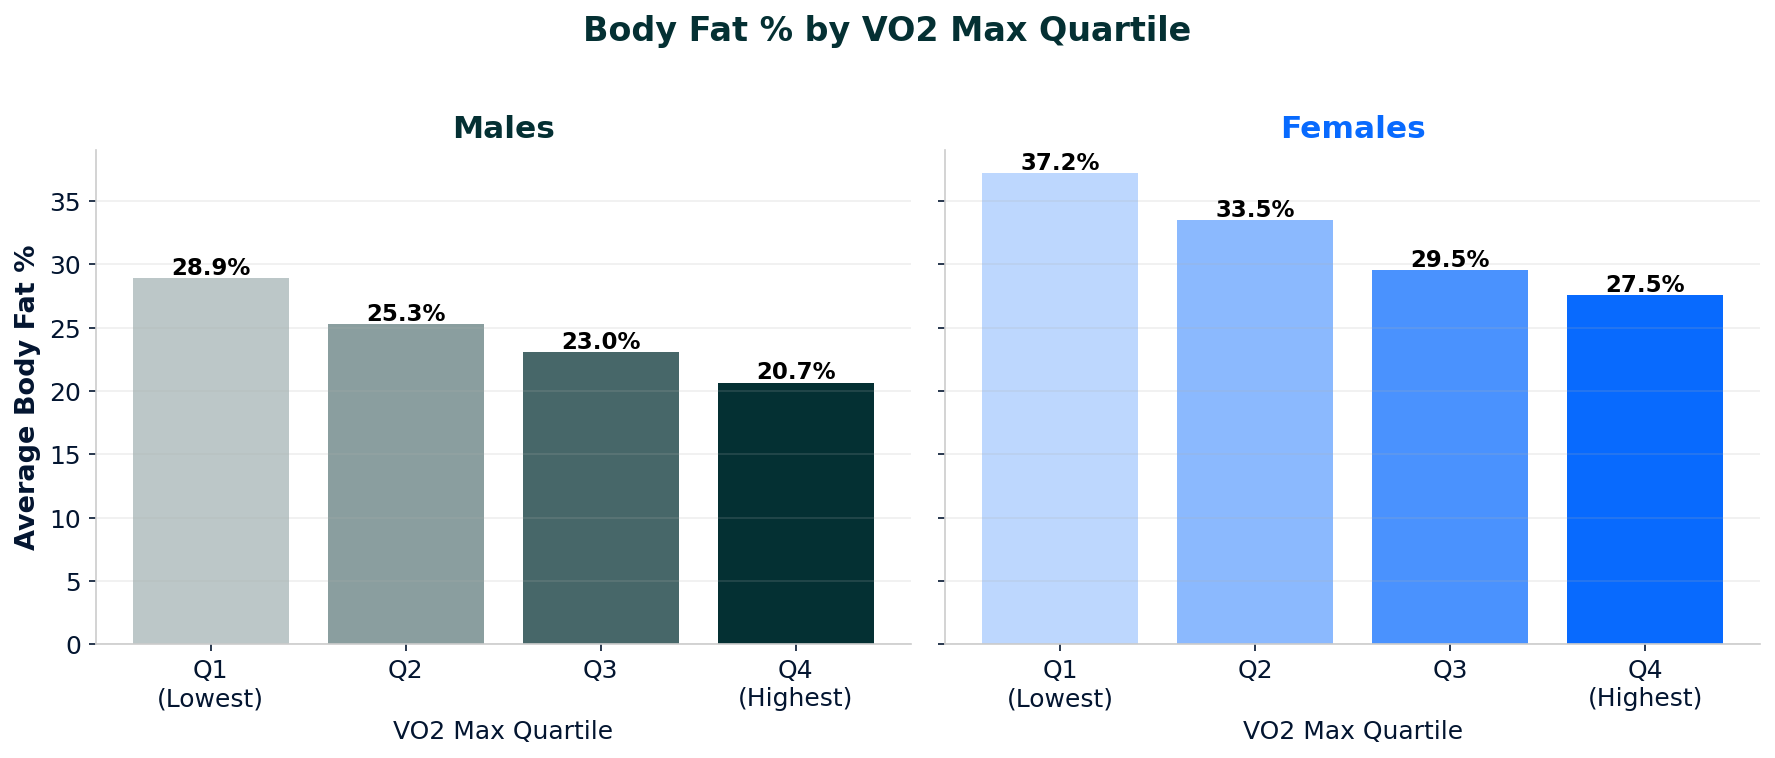
Gender Split
Males: High-VO2 men averaged 20.4% body fat with 20.2% trunk fat and 388g of visceral fat. Low-VO2 men: 29.2% body fat, 30.6% trunk fat, and 700g of visceral fat — nearly double.
Females: High-VO2 women averaged 27.3% body fat and 247g of visceral fat. Low-VO2 women: 37.8% body fat and 534g of visceral fat. Interestingly, arm and leg lean mass was similar across groups — the difference was almost entirely in trunk fat distribution.
How Much Are They Actually Working Out?
We asked 365 of these clients to report their typical exercise habits — how many days per week and how many minutes per session. Here’s what the three groups reported:
| High VO2 (≥48) | Mid VO2 | Low VO2 (≤33) | |
|---|---|---|---|
| Days/Week (median) | 4.5 | 4.0 | 4.0 |
| Mins/Session (median) | 60 | 45 | 45 |
| Weekly Volume (median) | 232 min | 180 min | 135 min |
The high-VO2 group puts in about 72% more weekly training volume than the low group — roughly 4 hours vs 2.25 hours per week. But the interesting part: the statistical correlation between exercise volume and VO2 max is still weak (r = 0.02, p = 0.66). Frequency alone doesn’t predict fitness.
Looking at the raw responses paints a clearer picture. The top athletes describe sessions like “90–180 min”, “120 minutes”, “2–3 hours” — long, sustained efforts. The bottom group reports “20 minutes”, “15 min”, “brisk walking 30 min.” Same number of days, completely different intensity and duration.
The takeaway: it’s not just how often you show up — it’s how long and how hard you go when you do.
What the Top Athletes Have in Common
Looking at the training habits and body composition of our highest-performing clients, a clear pattern emerges. These aren’t people who just run every day or just lift weights. They do both — and they structure their intensity deliberately.
Zone 2 Base (3–4 sessions/week)
Long, steady-state cardio at 60–70% of max heart rate. Running, cycling, rowing, or swimming for 45–90 minutes. This builds mitochondrial density — the foundation for fat oxidation. The visceral fat data above tells the story: high-VO2 clients burn fat more efficiently at rest and during exercise.
High-Intensity Intervals (1–2 sessions/week)
Short, maximal-effort work: 30-second sprints, 4×4 minute VO2 max intervals, or Tabata-style efforts. This pushes the VO2 max ceiling higher. The data suggests that the top group isn’t training more days — they’re training harder on the days that count.
Resistance Training (2–3 sessions/week)
The regional scan data is clear: high-VO2 clients carry significantly more lean mass in their arms, legs, and trunk. Compound movements — squats, deadlifts, presses, rows — build the muscle that supports both metabolic health and cardiovascular performance.
Sample Weekly Template
| Day | Session | Duration |
|---|---|---|
| Monday | Strength (Lower Body) | 45–60 min |
| Tuesday | Zone 2 Cardio | 45–60 min |
| Wednesday | Strength (Upper Body) | 45–60 min |
| Thursday | Zone 2 Cardio | 45–60 min |
| Friday | HIIT / VO2 Max Intervals | 25–35 min |
| Saturday | Zone 2 Cardio (longer) | 60–90 min |
| Sunday | Rest / Active Recovery | — |
Data: 646 BodyStats clients tested between August 2024 and April 2026 in Vancouver and Toronto. All correlations are Pearson r with two-tailed p-values. Regional body composition data available for 403 clients. Exercise frequency and duration self-reported via intake forms (n=365). DEXA scan images shown with client consent. Individual results may vary. This article is for informational purposes only and does not constitute medical advice.
Want to raise your score? Here’s how to improve your VO2 max.
Our VO2 max tests use the Bruce Protocol — the gold standard of graded exercise testing.
See what these changes look like over time in our Top 10 Client Transformations.