

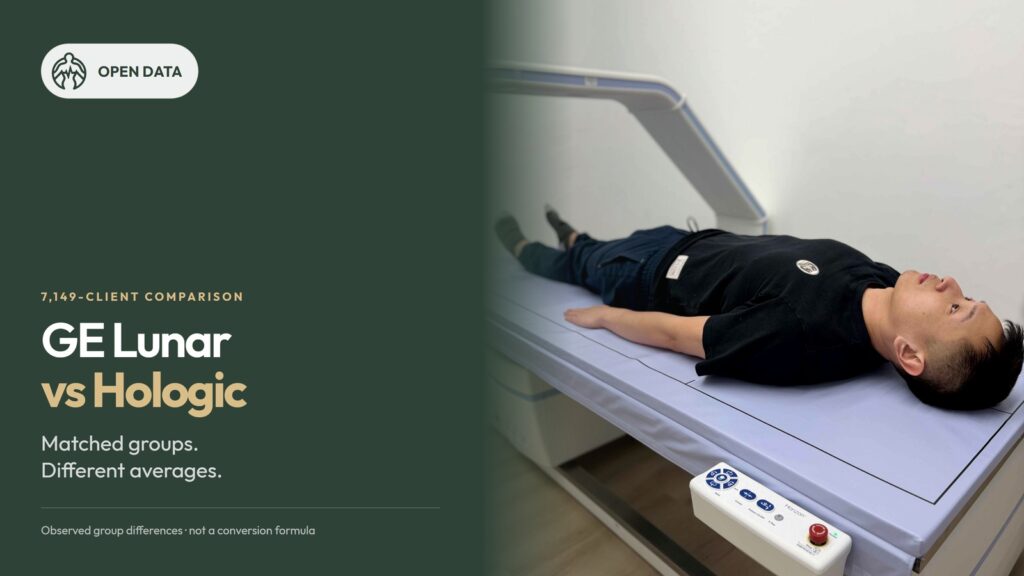
Hologic and GE Lunar look dramatically different.
Both examples below were reported at 28.9% body fat. They are different people, so compare how each system renders its colour image—not their body shapes.
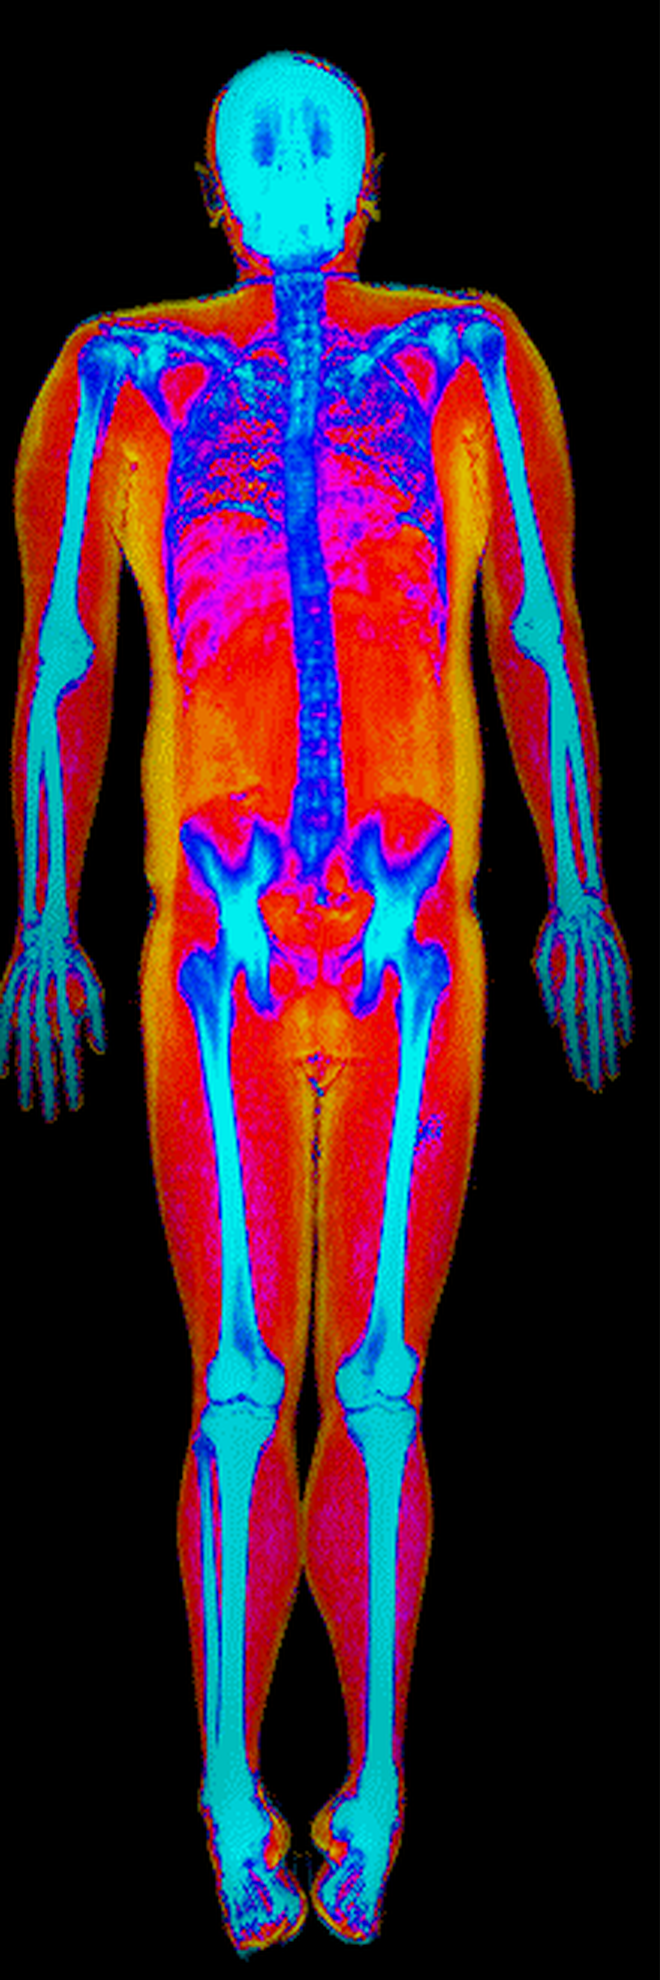
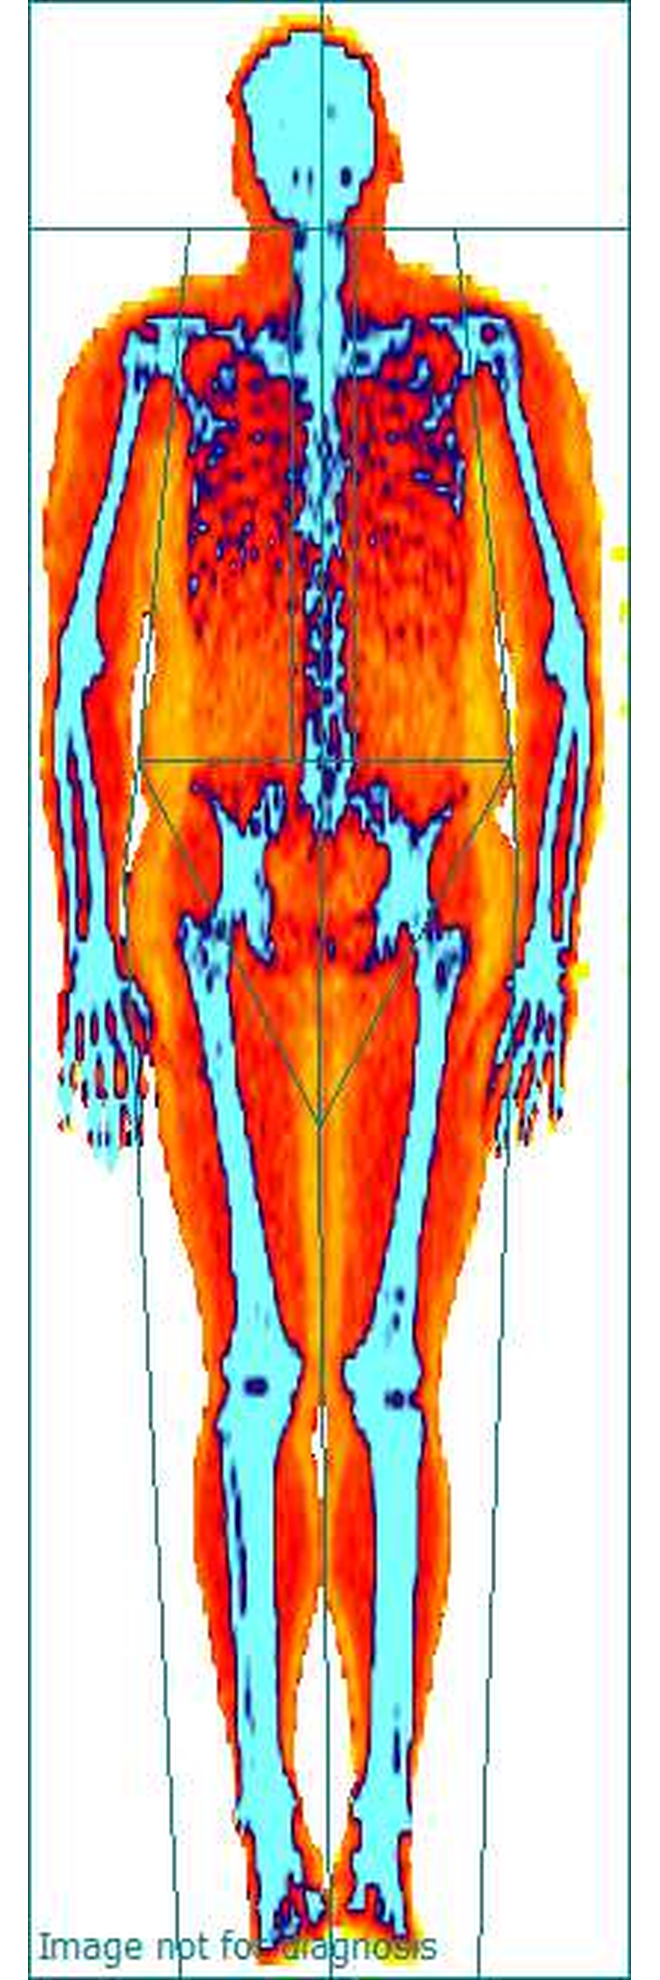
Real, anonymized BodyStats dashboard images from different clients. The images show presentation differences; they are not a same-person comparison.
People ask us this all the time: “Will my results be different on a GE Lunar Prodigy versus a Hologic DEXA?”
The honest answer is that results can differ. Both are established DEXA systems, but they use different calibration, segmentation and analysis methods. Switching systems can therefore mix true body change with measurement and software differences.
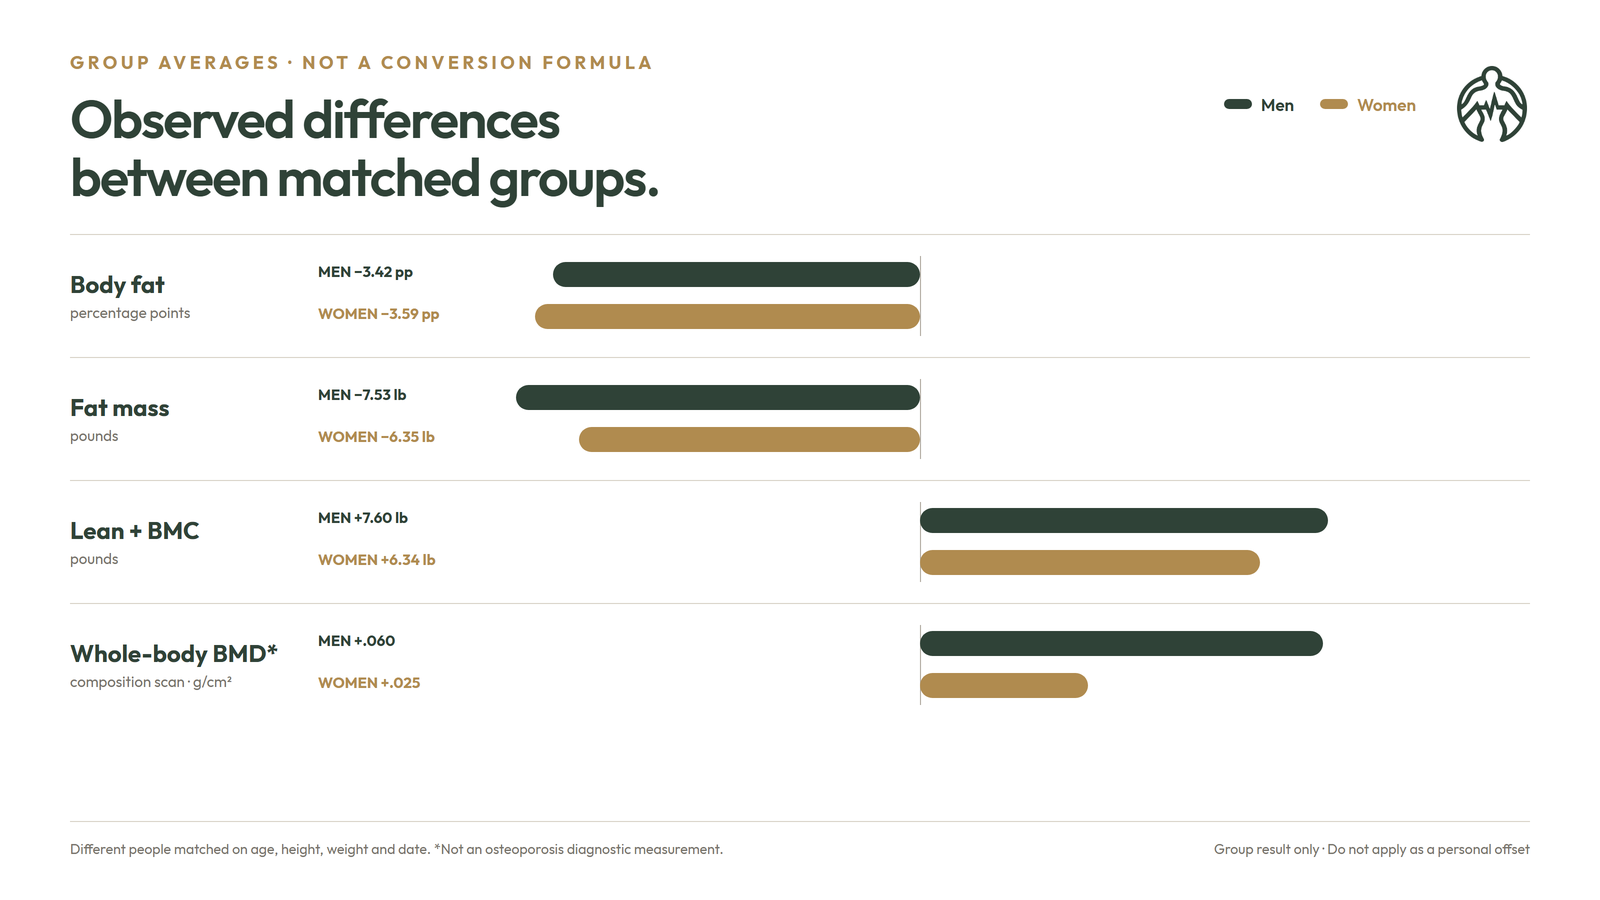
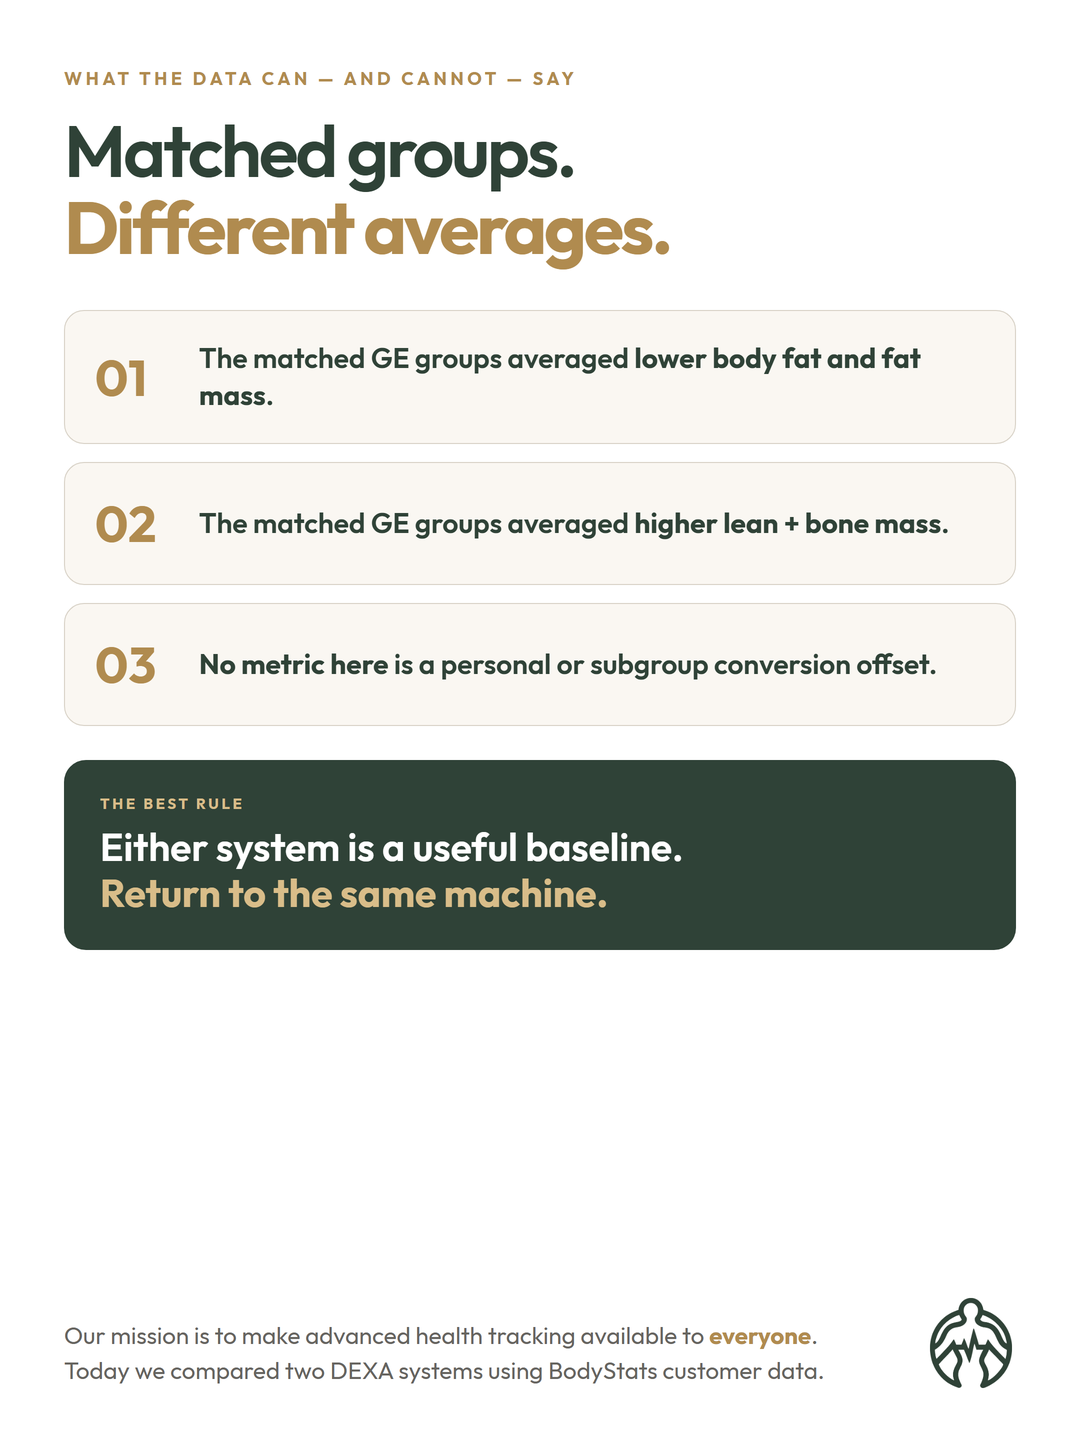
Matched GE groups averaged about 3½ percentage points lower body fat.
Across records balanced on age, height, weight and date, GE groups also averaged roughly 6–8 lb less fat mass and 6–8 lb more lean-plus-bone mass. These are group averages—not a correction to apply to one person.
To quantify the gap, we examined 7,149 BodyStats clients scanned between May 1 and August 28, 2026 across our GE Lunar Prodigy and Hologic systems. We then matched people by sex, age, height, body weight and scan date so we were comparing like with like as closely as an observational dataset allows.
What we did
Our primary analysis used each customer’s latest valid scan per machine during the shared comparison window. That produced 2,781 Hologic and 893 GE male profiles, plus 2,688 Hologic and 979 GE female profiles. Individual metric counts vary because not every report contained every measurement.
For the adjusted comparison, every GE record was matched to a Hologic record from a different person of the same sex within three years of age, two inches of height, eight pounds of body weight and 30 days of scan date. The final matched samples contained 839 male comparisons and 921 female comparisons. Their average remaining weight difference was effectively zero.
What we found in men
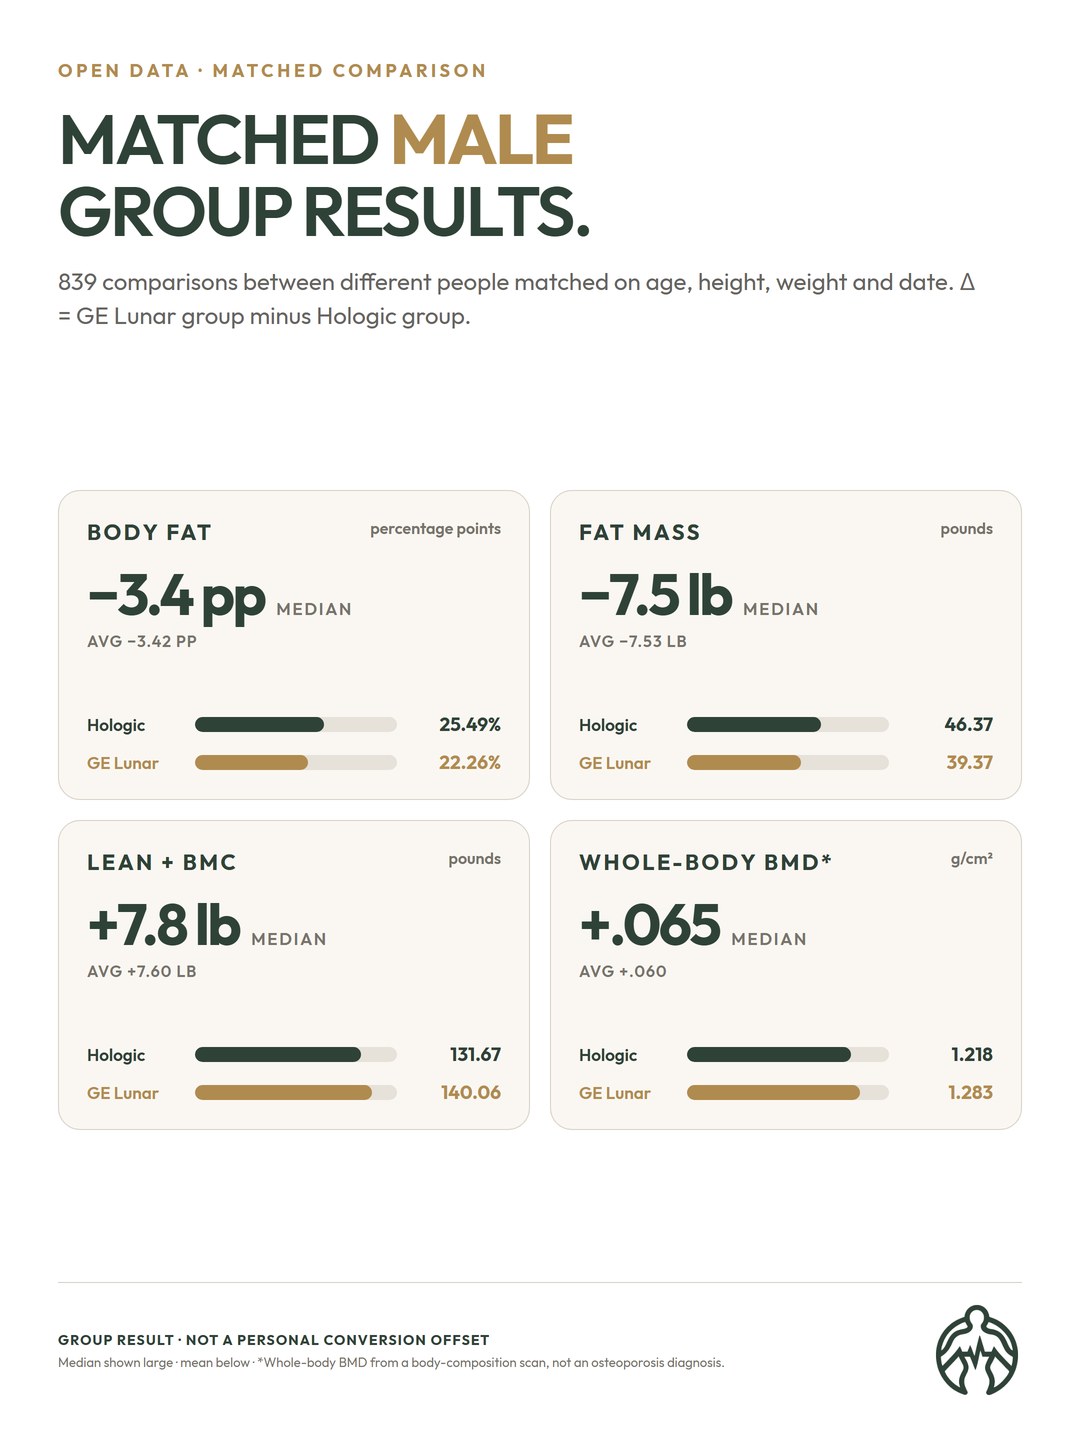
| Metric | Hologic group | GE Lunar group | Matched group Δ |
|---|---|---|---|
| Body fat | 25.49%median 25.0% | 22.26%median 22.1% | −3.42 ppmedian −3.4 pp |
| Fat mass | 46.37 lbmedian 42.95 lb | 39.37 lbmedian 36.5 lb | −7.53 lbmedian −7.48 lb |
| Lean + BMC | 131.67 lbmedian 130.23 lb | 140.06 lbmedian 138.7 lb | +7.60 lbmedian +7.78 lb |
| Appendicular lean index | 8.42median 8.33 | 9.12median 9.06 | +0.64median +0.63 |
| Bone mineral content | 6.08 lbmedian 6.0 lb | 6.97 lbmedian 6.9 lb | +0.88 lbmedian +0.89 lb |
| Whole-body BMD* | 1.218median 1.212 | 1.283median 1.280 | +0.060median +0.065 |
Among matched male records, the GE group averaged 3.42 percentage points less body fat, 7.53 lb less fat mass and 7.60 lb more lean-plus-bone mass than the Hologic group. Whole-body BMD from the composition scan also differed by +0.060 g/cm².
What we found in women
| Metric | Hologic group | GE Lunar group | Matched group Δ |
|---|---|---|---|
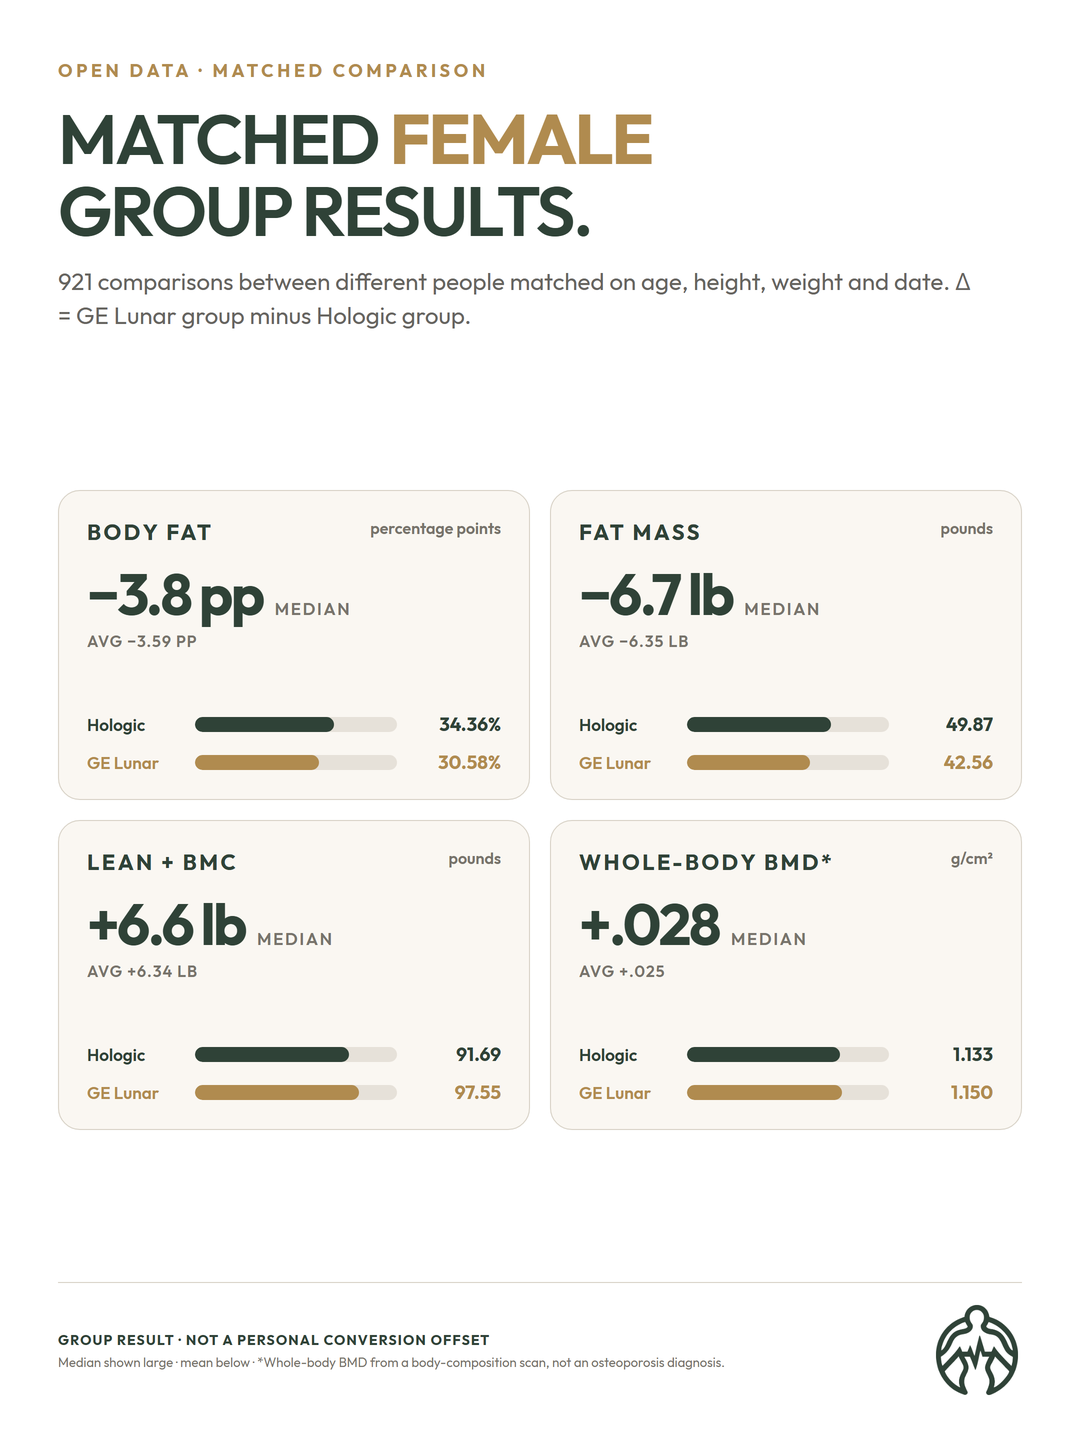
| Body fat | 34.36%median 34.2% | 30.58%median 30.5% | −3.59 ppmedian −3.8 pp |
| Fat mass | 49.87 lbmedian 45.66 lb | 42.56 lbmedian 38.8 lb | −6.35 lbmedian −6.72 lb |
| Lean + BMC | 91.69 lbmedian 89.54 lb | 97.55 lbmedian 95.9 lb | +6.34 lbmedian +6.59 lb |
| Appendicular lean index | 6.34median 6.23 | 7.01median 6.97 | +0.70median +0.72 |
| Bone mineral content | 4.77 lbmedian 4.72 lb | 5.24 lbmedian 5.2 lb | +0.54 lbmedian +0.53 lb |
| Whole-body BMD* | 1.133median 1.132 | 1.150median 1.144 | +0.025median +0.028 |
Among matched female records, the GE group averaged 3.59 percentage points less body fat, 6.35 lb less fat mass and 6.34 lb more lean-plus-bone mass than the Hologic group. Whole-body BMD from the composition scan also differed by +0.025 g/cm².
Why might the group averages differ?
DEXA does not directly count every pound of fat or muscle. It measures how two X-ray energies pass through the body, then applies a manufacturer-specific model to classify tissue and define body regions. Manufacturer differences that may contribute include:
- Calibration: each manufacturer calibrates its hardware and reference values differently.
- Tissue allocation: the systems can divide the same measured mass differently between fat, lean tissue and bone mineral content.
- Region boundaries: android, gynoid, trunk and limb regions are not segmented identically.
- Reference data and software: derived values can depend on the manufacturer’s software and reference population.
The near-zero average weight difference is consistent with the systems allocating measured mass differently between tissue categories. But because the main analysis compared different people at different locations, it cannot isolate scanner calibration from every remaining population, site, positioning or protocol difference. Neither a lower body-fat number nor a higher lean-mass number means one machine is “better.”
What about visceral fat?
No metric in this report produced a validated universal offset. VAT was especially inconsistent: in the matched analysis, the GE group’s VAT mass averaged 71 g higher in men but 57 g lower in women. VAT volume pointed lower in the GE group, but GE volume coverage was much smaller.
The close-together same-customer sample was also too small and uncertain to confirm either direction. That means we would not give a customer a formula such as “add 50 g” or “subtract 100 cm³” when switching systems. The data does not support one.
Whole-body bone measurements in this dataset
The whole-body BMD value from these body-composition scans averaged +0.060 g/cm² higher in the matched male GE group and +0.025 g/cm² higher in the matched female GE group. We report that only as an observed whole-body composition output.
This was not an osteoporosis diagnostic study. BodyStats used whole-body composition scans, not dedicated diagnostic spine, hip or forearm protocols. The International Society for Clinical Densitometry limits diagnostic classification to specific skeletal sites such as the lumbar spine, femoral neck, total hip/femur and, in defined circumstances, the 33% radius. We therefore do not use these whole-body results to diagnose osteoporosis, estimate fracture risk or translate medical bone-density results between systems.
An exploratory same-customer check
Thirty-five customers used both systems within seven days. This was more direct than the main matched-group analysis, but it was not a controlled cross-calibration protocol: participants were not scanned repeatedly on each machine under standardized preparation and positioning, and the sample was not designed to test different heights, body masses or composition ranges.
- GE body fat was 2.61 percentage points lower in men and 3.89 points lower in women.
- GE fat mass was 5.11 lb lower in men and 5.91 lb lower in women.
- GE lean-plus-bone mass was 7.79 lb higher in men and 8.24 lb higher in women.
- GE whole-body BMD from the composition scan was 0.059 g/cm² higher in men and 0.041 g/cm² higher in women.
These exploratory averages pointed in a similar direction to the matched-group results. They still cannot establish whether the difference is stable, predict an individual result or support a conversion equation.
What we still don’t know
This dataset cannot tell us whether the GE-minus-Hologic difference stays the same for someone below 15% body fat, above 30% body fat or anywhere in between. It also cannot tell us whether height, total mass, fat distribution or muscularity changes the within-person difference.
Answering those questions requires a purpose-built crossover study: the same representative participants scanned repeatedly on both systems under standardized conditions, with machine precision measured and individual differences analyzed across body-composition ranges. Until then, a mean group difference is an observation—not an offset.
Which machine should you choose?
For a first scan, either system can give you a useful baseline. Choose the location, appointment and experience that work best for you. The important decision comes later:
Return to the same machine for follow-up scans whenever possible.
Consistency makes changes easier to interpret because you are comparing like with like instead of mixing biological change with system and protocol differences.
A few notes on what you’re looking at
- This was observational. Customers were not randomly assigned to scanners. Matching reduced measurable differences but cannot remove every population, location, positioning, protocol or selection effect.
- The main comparison used different people. It estimates differences between matched groups, not the effect of switching machines on one person.
- No subgroup conversion was tested. We did not establish separate within-person differences below 15%, above 30% or across other body-composition ranges.
- The same-customer check was exploratory. The 35 close-together customers were not part of a standardized repeated-scan cross-calibration study.
- Missing coverage varies. GE VAT volume and whole-body BMD were unavailable on some reports, so those comparisons use smaller samples.
- Body composition is not static. Hydration, positioning, food intake, recent training and normal biological variation can affect any individual scan.
- Whole-body BMD is not an osteoporosis diagnosis. BodyStats uses whole-body DEXA for fitness and self-tracking. Diagnostic bone-density questions belong with a qualified healthcare professional using the appropriate site-specific protocol.
Why we share this
Our mission is to make advanced health tracking available to everyone. That includes being transparent about what the numbers can—and cannot—tell you.
This article continues our open-data series. You can also explore what our scans showed about fat and muscle during weight loss and fat and muscle during weight gain.
Ready to establish your baseline?
Book a BodyStats DEXA scan in Vancouver or Toronto—and use the same system for your follow-up.
If there is another question you want us to investigate, tell us on Instagram at @body.stats. If our data can answer it, we will look.